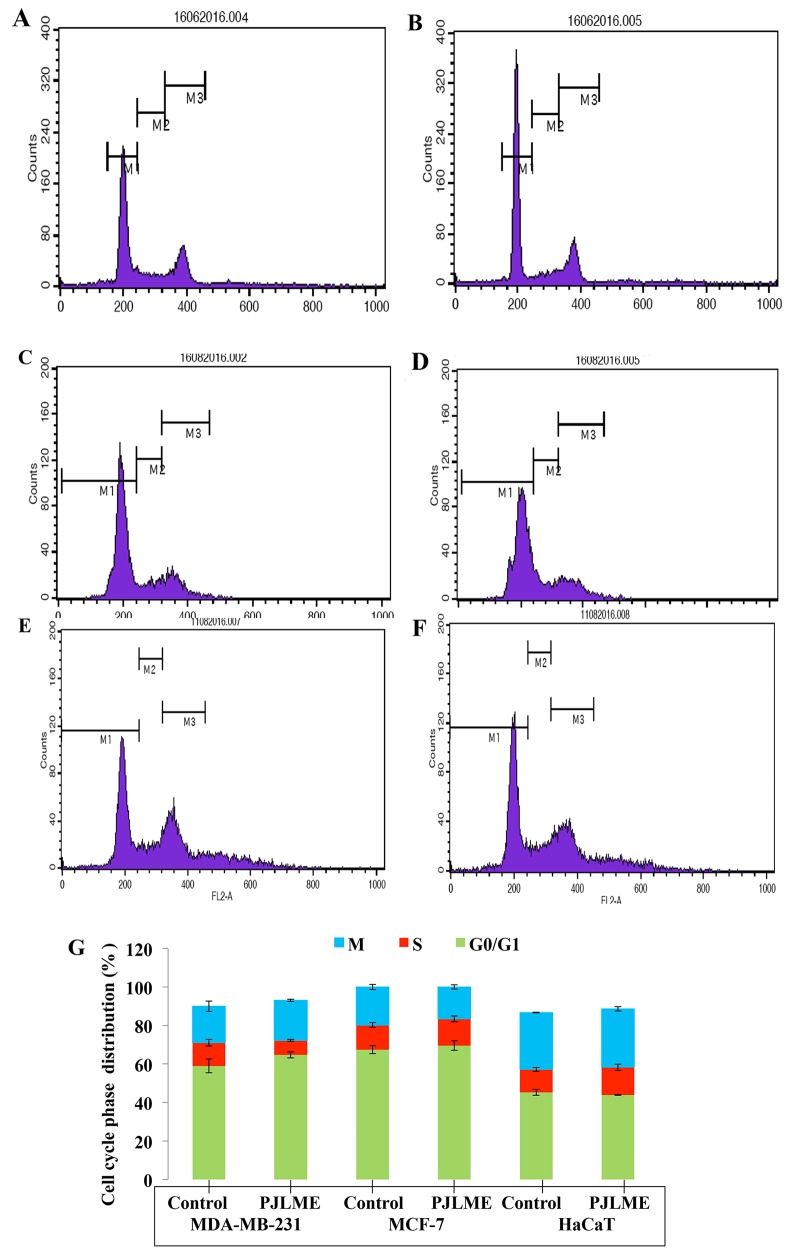
Figure 8.
(A-F) Flow cytometric analysis of effect of PJLME on cell cycle of MDA-MB-231, MCF-7 and HaCaT cells. The cells were treated with PJLME (16.8μg/mL) and vehicle control (DMSO 0.1%) for 72 h & were analyzed using FACS (Calibur flow cytometer; BD Biosciences, CA, USA). The cell cycle phase profile of MDA-MB-231: (A) Control (B) PJLME. The cell cycle phase profile of MCF-7: (C) Control, (D) PJLME. The cell cycle phase profile of HaCaT: (E) Control (F) PJLME treatment. (G) Graphical presentation of distribution (%) of cells in different phases of cell cycle. The values in the bars indicates the % population of cells in respective cell cycle phases.

