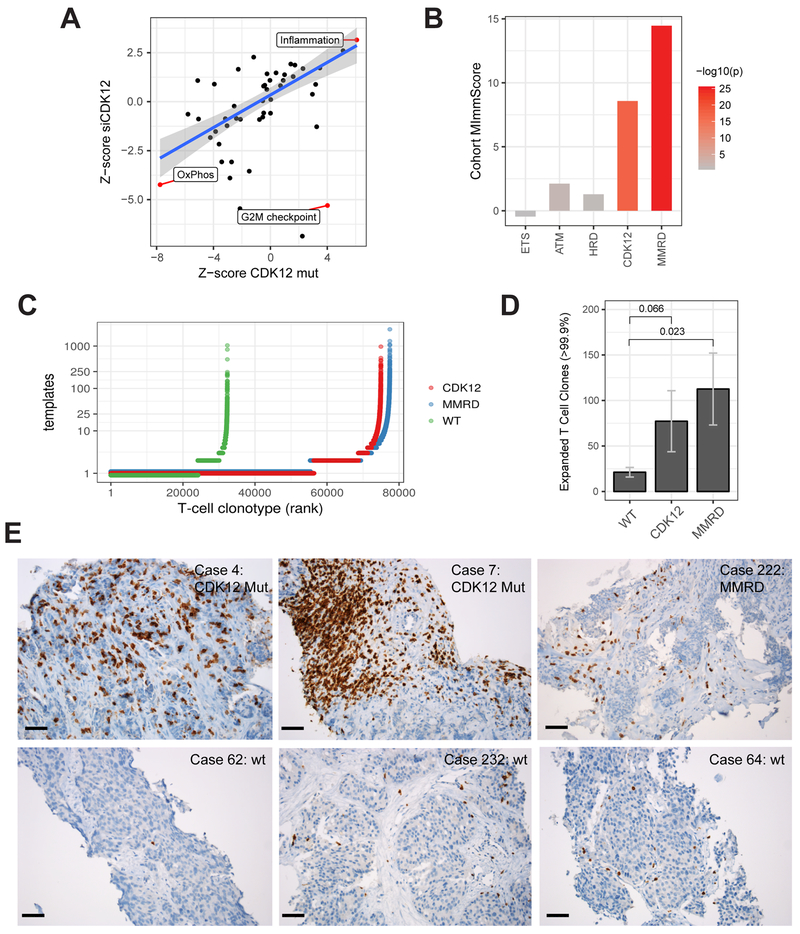
Figure 6. Immunogenomic properties of CDK12-mutant tumors.
(A) Differential expression of MSigDB cancer hallmark gene-sets in CDK12-mutant patients and in LNCaP cells depleted with CDK12 by siRNA. Highlighted hallmarks are significant (FDR < 0.05, limma moderated t-test).
(B) Levels of global immune infiltration across prostate tumors with distinct genetic drivers compared to genetically stable (PGD wild-type) tumors. The “Cohort MImmScore” is defined as the gene-set enrichment Z-score and p-value based on Random-Set test and moderated cohort DE log2 fold-changes.
(C) Overview of T cell clonotypes across CDK12-mutant (n=10), MMRD (n=10), and WT (n=10) tumors. T cell clonotypes (i.e. identical CDR3 sequences) are ranked by their frequency (number of templates). CDK12-mutant and MMRD tumors show, overall, an increase in the total number of T cells (X-axis), and higher levels of clonal expansion (Y-axis).
(D) Comparison of clonal expansion between immunogenic (MMRD, CDK12) and wild-type mCRPC tumors (t-test). Expanded clones are defined as those with the highest number of clonal expansion (estimated number of templates > 99.9 percentile across all cohorts; n > 12).
(E) Immunohistochemistry (IHC) performed on formalin-fixed paraffin-embedded tumor sections using anti-CD3 antibody. Six representative cases are shown, including two CDK12-mutant tumors, one MMRD tumor, and three tumors which are wild type for CDK12, MMR genes, and HR genes. Black bar: 50 μm.
See also Figure S7.

