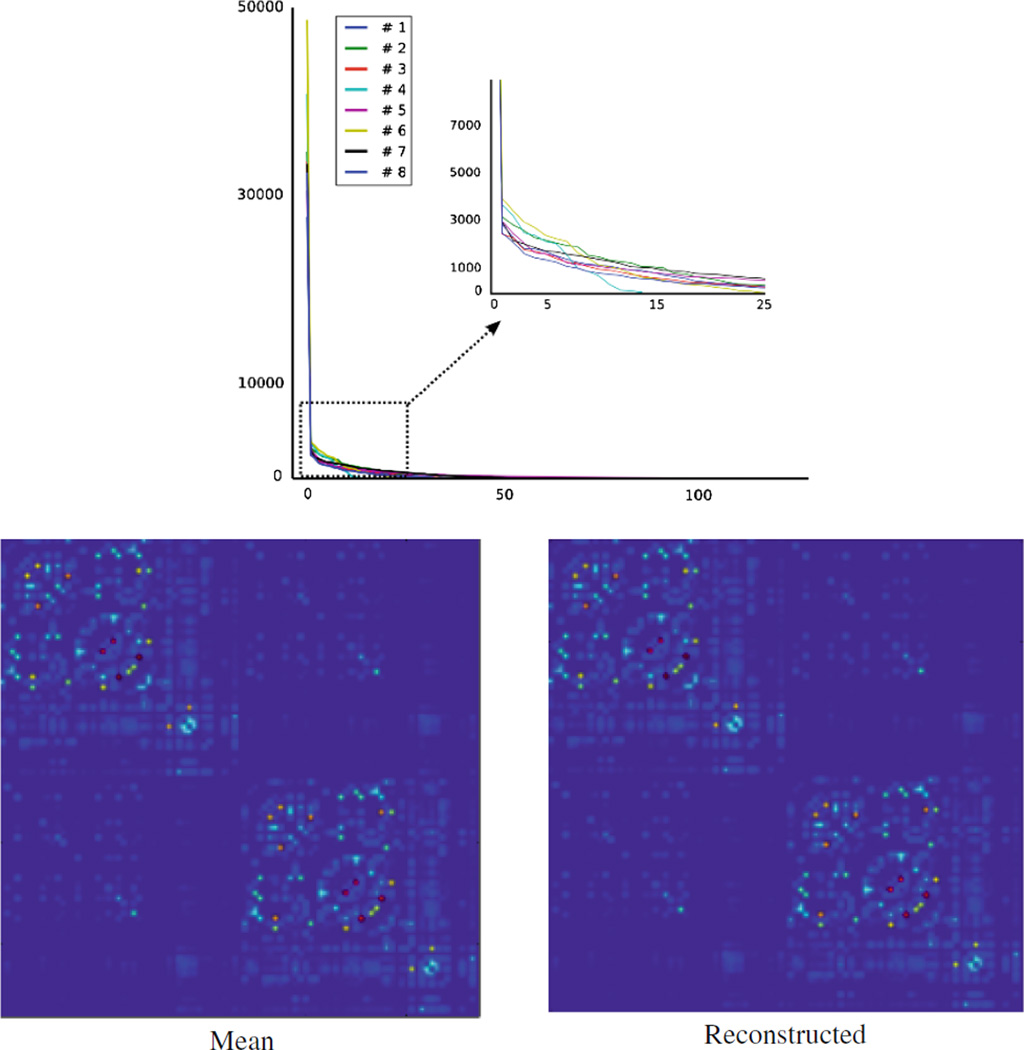
Fig. 2.
Top: Singular values of X in Eq. (6), for eight subnetworks. For each subnetwork, we have one clearly dominant singular value. Bottom left: Mean connectivity matrix of our clinical sample. Bottom right: Reconstructed mean connectivity matrix using (5). Similarity between the two is easily noticeable, illustrating the reliability of reconstruction.

