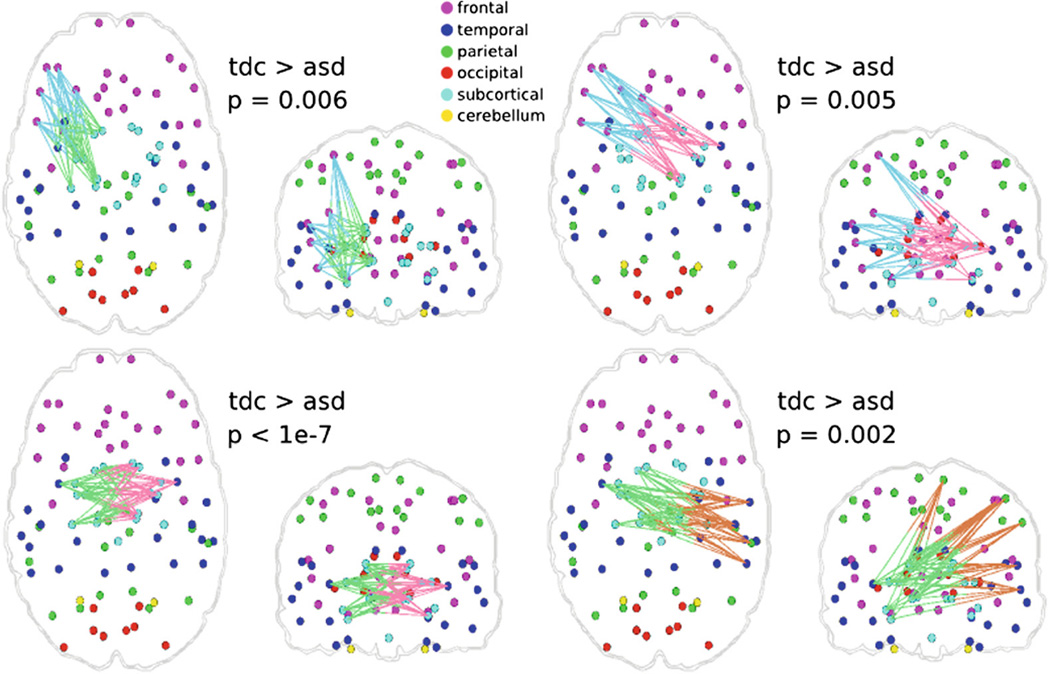
Fig. 4.
Connections with significant (p < 0.01) group differences between TDC and ASD samples, for the 12 subnetwork case. Colors of edges correspond to the subnetworks that they are part of (see Fig. 3). They are all two-colored since they are connections between two subnetworks. Connections that are significantly different are between subnetworks #3 (brown), #5 (blue), #6 (green), and #7 (pink) (Color figure online).

