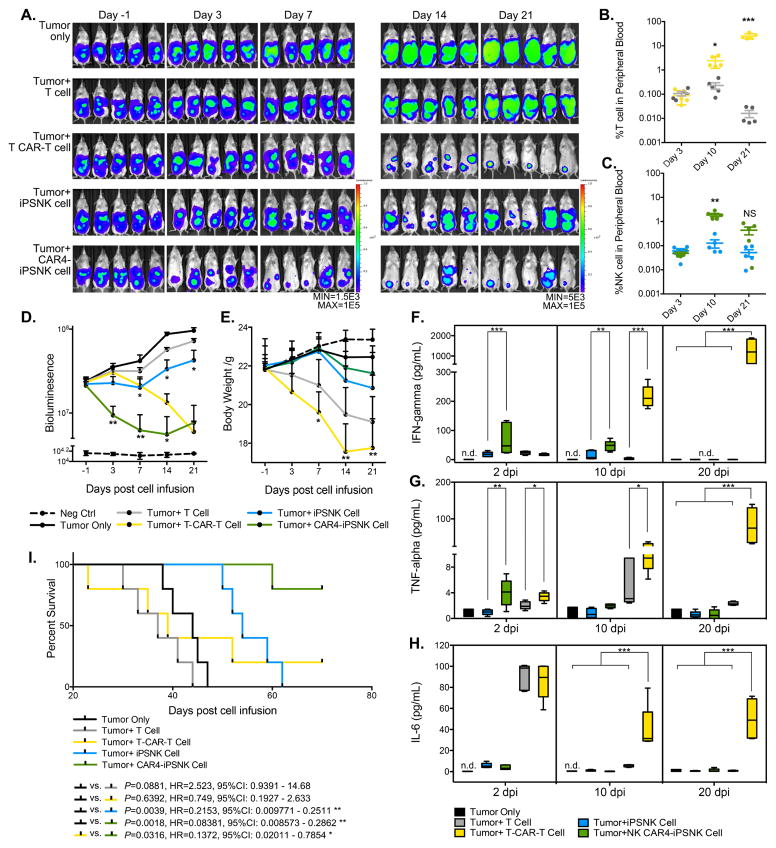
Figure 5. Comparison of CAR-expressing T cells to CAR-expressing NK cells.
(A) NSG mice were inoculated intraperitoneally with 2 × 10⁵ luc+ A1847 cells. 3 days later, mice received 225cGy radiation following with 1.0 × 10⁷ of iPSC-NK or T cell populations infusion intraperitoneally. Cytokines were administrated as indicated in previous for the following 21 days in mice that received iPSC-NK population treatment only. Tumor burden was determined by weekly BLI imaging until day 21. Images of representative time points are shown. (B and C) Flow cytometric quantification of (C) CD45+CD3+ T cell populations and (B) CD45+CD56+CD3- iPSC-NK populations from peripheral blood. Each dot represents one recipient mouse. (D) BLI data of tumor burden of each group monitored for 21 days post immune effector cell infusion (dpi). (E) Body weight of each group was monitored and plotted weekly in the time-course for 21 days post immune effector cell infusion. Mean ± S.D. is shown. Statistical analysis by two-tailed one-way ANOVA, T cells vs. iPSC-NK cells, T CAR(meso)-T cells vs. CAR4(meso)-iPSC-NK. (F–H) Levels of (F) hIFN-γ, (G) hTNF-α, and (H) hIL-6 were measured on plasma collected from peripheral blood in different days post immune effector cells infusion by ELISA assay. Median ± S.D. is shown. Statistic: two-tailed one-way ANOVA. (I) Kaplan-Meier curve represents the percent survival of the experimental groups.
Statistical analysis by two-tailed Log-rank test.
n.d.: not detected, NS: not significant, *P<0.05, ** P<0.01, *** P<0.001.
See also Figure S7B–S7D.

