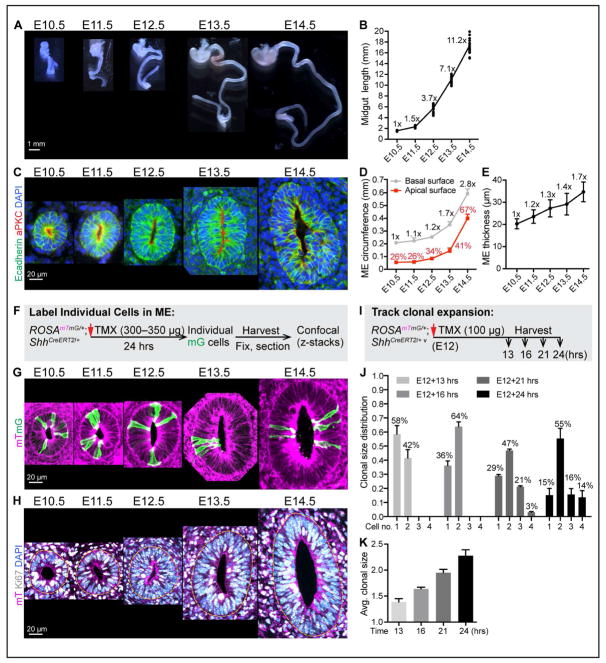
Figure 1. Midgut elongation, ME organization, cell proliferation and clonal expansion during Phase I.
(A) Isolated fetal mouse GI tracts from E10.5 to E14.5; stomach at top.
(B) Quantitation of Phase I midgut length. Length fold change over time, compared to E10.5 length, is indicated at each time point (e.g., 11.2x overall at E14.5).
(C) Structure of Phase I ME tubes. Paraffin sections of the mid-region of midguts, stained with E-cadherin (green), aPKC (red) and DAPI (nucleus, blue).
(D) Quantitation of the apical and basal circumferences of mid-region of ME tubes. Numbers on grey line indicate fold change in basal circumference over time, compared to E10.5. Numbers (%) on red line indicate the ratio of apical circumference/basal circumference at each time point. Data are represented as mean and standard deviation (SD).
(E) Epithelial thickness at the mid-region of ME tubes. Numbers indicate thickness fold change overtime, compared to E10.5 value (e.g., 1.7x at E14.5). Data are represented as mean and SD.
(F) Strategy for labeling individual cells in ROSAmTmG/+;ShhCreERT2/+ ME.
(G) 3D reconstructions from vibratome-sectioned, TMX treated ROSAmTmG/+;ShhCreERT2/+ midguts.
(H) Confocal slice of vibratome-sectioned ROSAmTmG/+ midguts labeled with mT (magenta), Ki67 (white) and DAPI (nuclei, blue). Dotted yellow line marks the basal surface of ME.
(I) Strategy for tracking clonal expansion in ROSAmTmG/+;ShhCreERT2/+ ME.
(J–K) Distribution of clonal size (number of cells within a clone) at 13, 16, 21, and 24 hrs after TMX treatment (J). Average clonal size over time (K). Data are represented as mean and SD.

