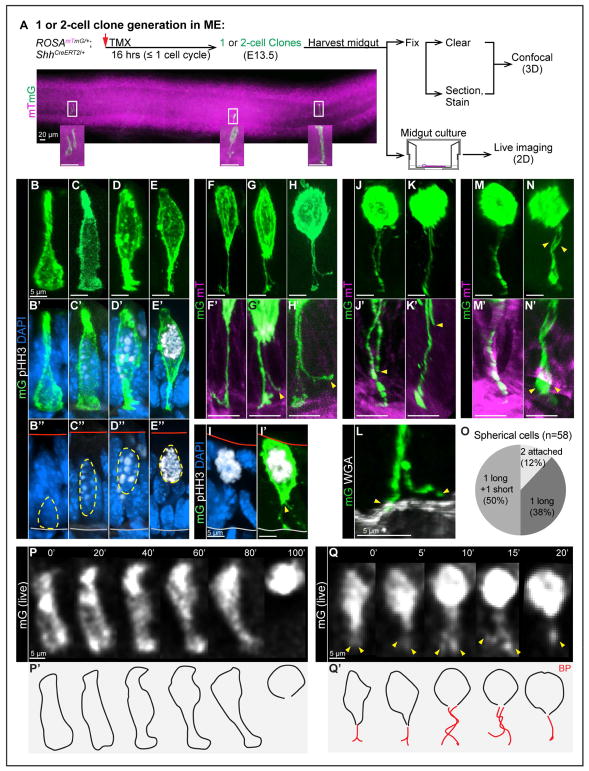
Figure 2. Individual cell behavior before and during mitosis: nuclear apical migration, BP retention, splitting and retraction.
(A) Strategy for generating one or two-cell clones in ME for confocal (3D) and live (2D) imaging. A stitched image shows a full view of one segment of midgut.
(B–E”, I–I’) 3D reconstructions of individual mG cells from vibratome-sectioned ROSAmTmG/+;ShhCreERT2/+ midguts, stained with pHH3 (white) and DAPI (nuclei, blue). Red and grey lines in B”–E” mark apical and basal surfaces, respectively.
(F–H, F’-H’, J, K, J’, K’, M, N, M’, N’) 3D reconstructions of individual mitotic mG cells from fixed, whole-mount cleared ROSAmTmG/+;ShhCreERT2/+ midguts. Images reveal BP retention (F), BP splitting (G, H), BP retraction (J, K), complete BP retraction (M), two attached BPs (N). F’–H’, J’, K’, M’, N’ are high-magnification of BP(s) in F–H, J, K, M, N, respectively.
(L) 3D reconstructions of a split BP from vibratome-sectioned ROSAmTmG/+;ShhCreERT2/+ midguts, stained with WGA (white). Only one of two end-feet (arrowheads) is attached to the basal lamina.
(O) Distribution of spherical cells with 1 long and 1 short BP, 2 attached BPs, and 1 BP.
(P, P’, Q, Q’) Successive 2D live images captured from cultured midguts. Numbers on top indicate minutes. Nuclear apical migration through the complete cell rounding; the BP becomes undetectable (P). BP splitting (arrowheads) and potential retraction at 15’. The final frame (at 20’) has one detectable BP (Q). P’–Q’ are outlines of cells in P and Q, red lines are BP(s).

