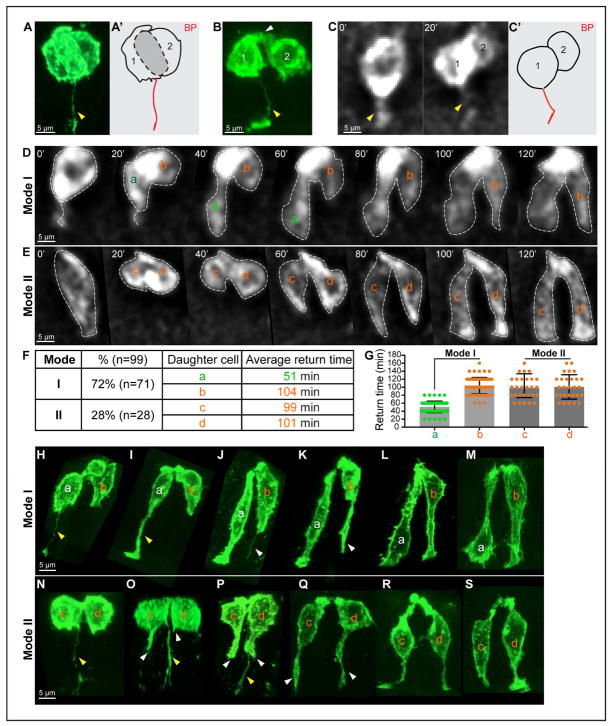
Figure 3. Daughter cell behavior during cytokinesis and G1 phase: asymmetric BP inheritance, two Modes of basal return.
(A, A’, B) 3D reconstructions of mG cells during (A) and after (B) cytokinesis from fixed, whole-mount cleared midguts. Note the asymmetric inheritance of the BP (yellow arrowhead) and an apical link (white arrowhead). A’ is a tracing of cell shapes, emphasizing the flat cytokinetic plane (grey) between the recently divided cells (1, 2) in A.
(C, C’) Successive 2D live images (20 min interval) of cytokinesis and asymmetric BP inheritance. C’ is a tracing of the cell after cytokinesis in C.
(D, E) Successive 2D live images (20 min intervals) of Mode I (D) and II (E) basal return. Daughter cells are labeled “a”, “b” (Mode I; daughter “a” has the BP) and “c”, “d” (Mode II).
(F, G) Distribution of Mode I and II, and average time for basal return of each daughter. Data are represented as mean and SD.
(H–S) 3D reconstructions of daughter pairs during G1. Mode I (H–M); Mode II (N–S). Inherited BP(s) are indicated by yellow arrowheads, de novo filopodial protrusions are indicated by white arrowheads.

