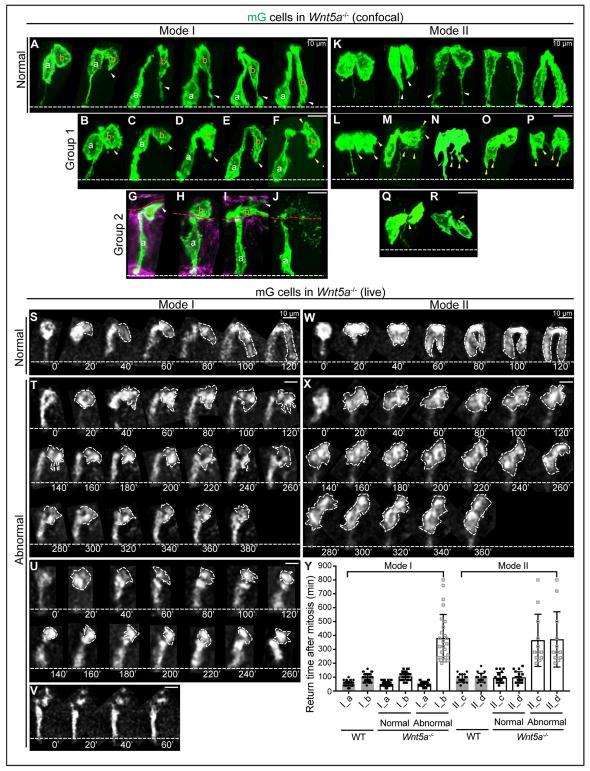
Figure 6. WNT5A guides “pathfinding” daughter cells to extend filopodia for basal return.
(A) 3D reconstructions of normal Mode I 2-cell clones in Wnt5a−/− ME.
(B–J) Abnormal Mode I 2-cell clones in Wnt5a−/− ME. Group 1, dominant filopodia are absent (yellow arrowheads) (B–F); group 2, one daughter cell is lumenally positioned (G–J).
(K) Normal Mode II 2-cell clones in Wnt5a−/− ME.
(L–R) Abnormal Mode II 2-cell clones in Wnt5a−/− ME. Abnormal appearing filopodia are marked with yellow arrowheads. Some pairs have no basal connection at all (O, P, R).
(S) Successive 2D live tracking (20 min intervals) of cells undergoing normal-appearing Mode I basal return in Wnt5a−/− ME.
(T–V) Abnormal Mode I daughter pairs in Wnt5a−/− ME. One daughter fails to return and remains apical (T), or becomes lumenal (U), or becomes fragmented (V).
(W) Normal Mode II return in Wnt5a−/− ME.
(X) Abnormal Mode II return in Wnt5a−/− ME. Both daughters remain apical.
(Y) Quantitation of basal return time for Mode I (a,b) and Mode II (c,d) daughters in WT and Wnt5a−/− ME. Solid circles and squares reflect the return time after mitosis. Hollow squares reflect the recording time of cells that stay at the apical side. Data are represented as mean and SD.

