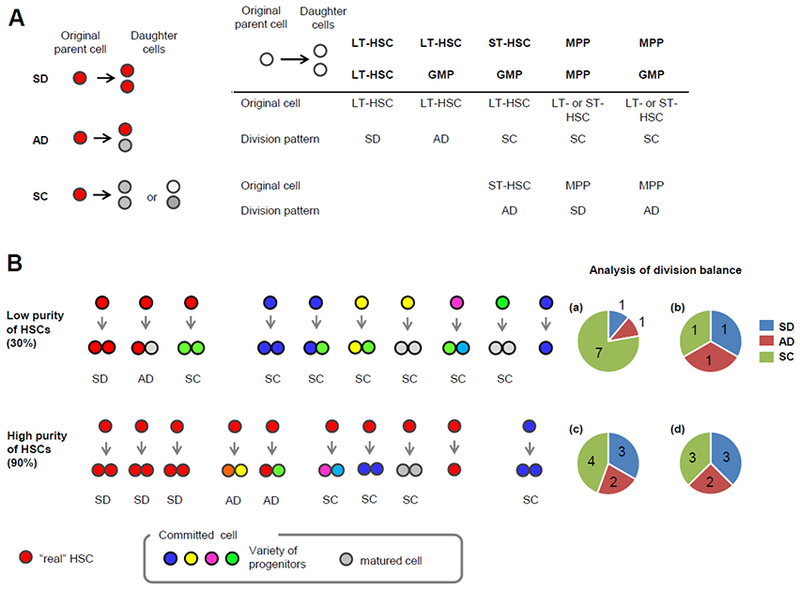
Figure 2. Division patterns by paired daughter cell assays.

(A) Original cell function affects its division pattern. Schematic model of 3 division patterns; after SD, both daughter cells have the same function and differentiation stage as the parent cell (red), while both daughter cells appear as more committed cells (grey or pale grey) than the parent cells after SC (left). After initial division of the parent cell from the HSC-enriched fraction, the repopulation capacity and/or differentiation potential of the paired daughter cells is individually determined (e.g. by in vivo repopulation capacity, retrospectively). As the HSC-enriched fraction is a heterogeneous population, the immunophenotypically isolated single cells from this fraction can be hematopoietic progenitors or mature cells. Some examples of the combinations of the parent cells, their daughter cells and their division patterns are shown at right bottom. (B) Analysis of division patterns in homogenous and heterogeneous populations. When 10 single cells are isolated from the population with 30% purity of HSCs, 3 are generally “real” HSCs (top). In this example, each of these three HSCs undergoes SD, AD and SC, respectively (b), and 1 cell does not undergo cell division during the assay period. Because committed cells are not able to produce HSCs, the division patterns of those cells are assessed as SC. Thus, the resulting division balance of the whole compartment will be 1 SD, 1 AD and 7 SC (a), and it is difficult to extract the phenotypes of real HSCs from this low purity of HSCs. However, in the case of 90% HSC purity (bottom), the division balance of HSCs (d) can be accurately estimated from the resulting division symmetry of the isolated whole population (c). SD, symmetric division; AD, asymmetric division; SC, symmetric commitment; LT-HSC, long-term hematopoietic stem cell; ST-HSC, short-term HSC; MPP, multi-potent progenitor; GMP, granulocyte-monocyte progenitors.
