
FIGURE 1.
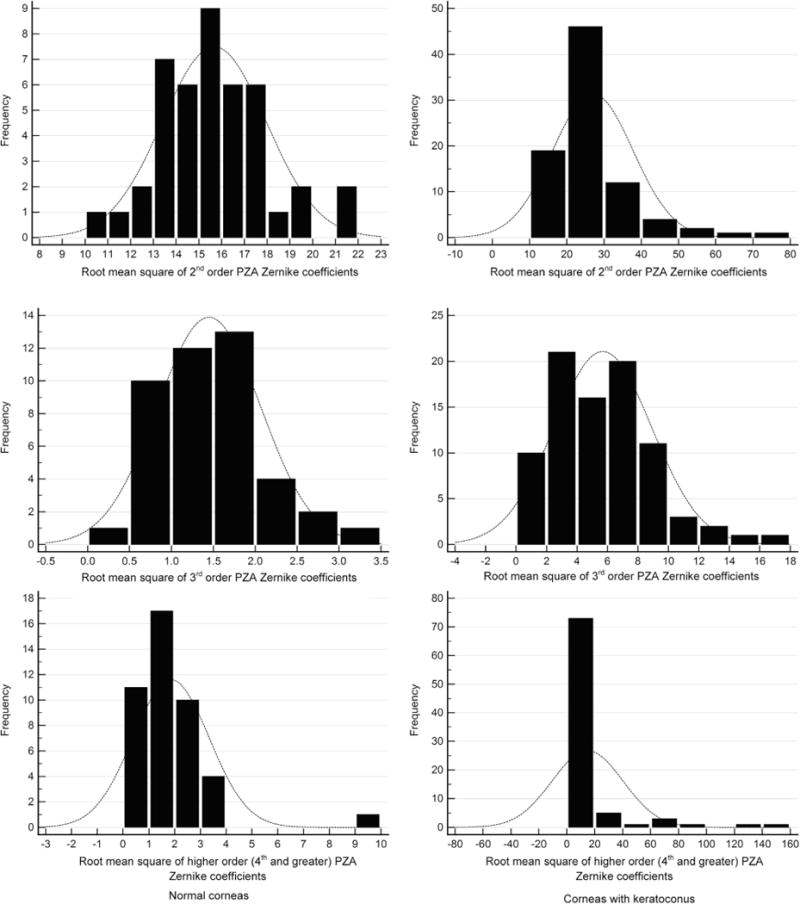
Frequency distribution of pachymetry Zernike analysis (PZA) coefficients in normal (Left column) and keratoconus (Right column) eyes. (Top left) Frequency distribution of root mean square of second-order PZA Zernike coefficients in normal eyes. (Top right) Frequency distribution of root mean square of second-order PZA Zernike coefficients in keratoconus eyes. (Middle left) Frequency distribution of root mean square of third-order PZA Zernike coefficients in normal eyes. (Middle right) Frequency distribution of root mean square of third-order PZA Zernike coefficients in keratoconus eyes. (Bottom left) Frequency distribution of root mean square of higher-order (fourth order and higher) PZA Zernike coefficients in normal eyes. (Bottom right) Frequency distribution of root mean square of higher-order PZA Zernike coefficients in keratoconus eyes.