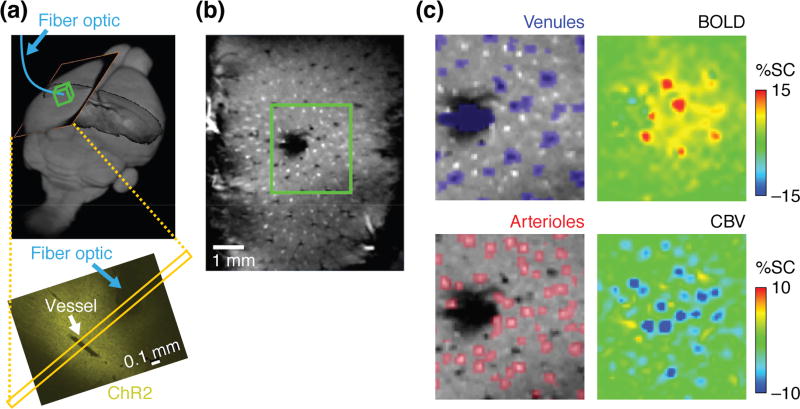
Figure 2.
Hemodynamic fMRI of neural activity signatures resolved at high spatiotemporal resolution. (a) Yu et al. [24] expressed channelrhodopsin-2 (ChR2) in rat somatosensory cortex and evoked neural responses using optogenetic stimulation via an implanted fiber (blue). Top panel shows orientation of MRI scans in (b–d) and bottom panel shows ChR2 expression pattern in a perpendicular slice. (b) A technique called multi-gradient imaging was used to identify single vessels based on contrast signatures in high resolution MRI scans (field of view corresponds to yellow slices in (a)). (c) Features in two forms of hemodynamic fMRI—blood oxygen level-dependent contrast (BOLD, top right) and cerebral blood volume-dependent contrast (CBV, bottom right)—could be correlated with regions identified as venules (top left) or arterioles (bottom left) based on data as in (b) (green boxed region). Figure adapted from ref. [24].

