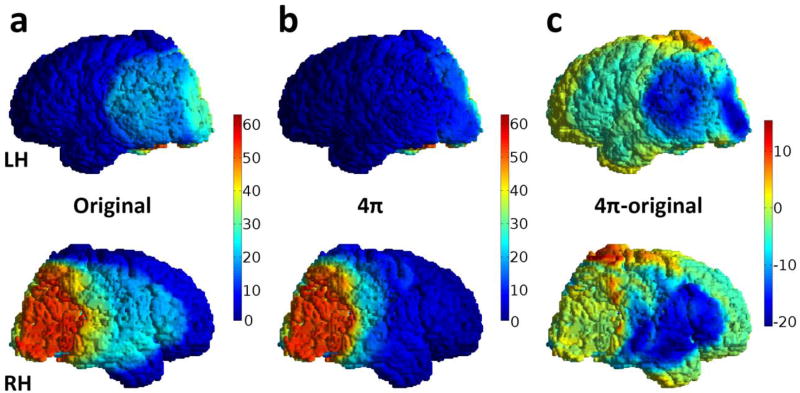
Fig. 4.
Illustrative dose maps on the cortical surface of the subject from Figure 1 (top row – left hemisphere (LH), bottom row – right hemisphere (RH)) a) original plan, b) 4π optimized plan and c) the absolute difference (4π – original). Dose reduction is as great as −20 Gy in some areas, but small non-coplanar volumes (red hot spots) received greater doses than the nearly zero dose in the coplanar plans.

