
Figure 4.
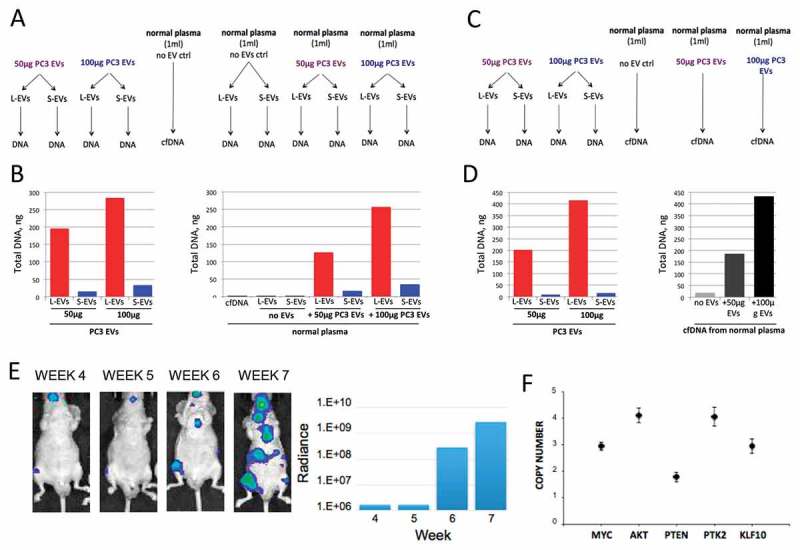
Extracellular DNA is enclosed mostly in L-EVs in plasma. (a) 50 or 100 μg of PC3 EVs was spiked in 1 ml of normal plasma. Plasma EVs were isolated, EV DNA was extracted and (b) quantified using HS dsDNA Qubit Assay. (c) 50 or 100 μg of PC3 EVs was spiked in 1 ml of normal plasma. Plasma cell-free (cf)DNA was extracted and (d) quantified using HS dsDNA Qubit Assay. (e) Representative bioluminescent images showing progressive bone and visceral metastasis following intracardial injection of 1 × 10⁷ luciferase-labelled PC3 cells in NOD/SCID mice (left). The bioluminescent signal was quantified weekly and was measured as radiance in p/sec/cm2/sr (right). (f) SCNV of MYC, AKT1, PTEN, PTK2 and KLF10 in plasma-derived L-EVs was assessed by dPCR, demonstrating that L-EVs in the plasma of a mouse model of bone metastases report tumour-specific SCNV. Copy number of each target gene was normalized to gene reference RNAse P. N = 3 for each data point.