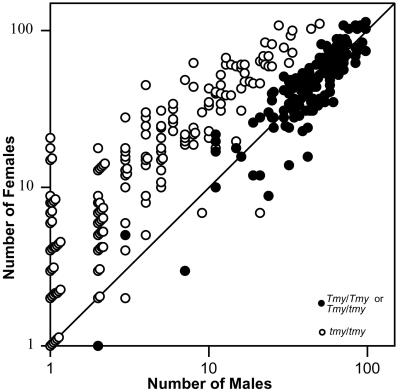
Figure 3.
Phenotypes of Tmy/Tmy and Tmy/tmy males (●) differ from those of tmy/tmy males (○). The diagonal line corresponds to a sex ratio of K = 0.5. Not included are 42 homozygous tmy males that produced only female progeny and five that produced only male progeny. The symbols for individuals with the same phenotype are stacked in the graph.

