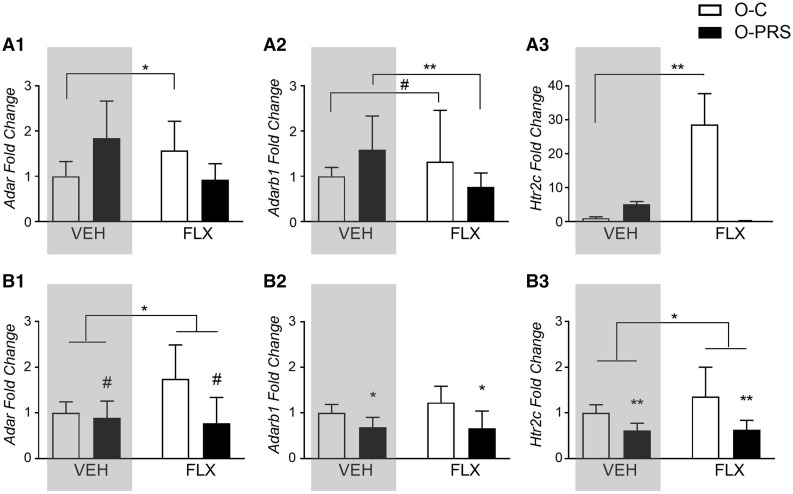
Figure 3:
maternal PRS- and FLX-induced changes in Adar, Adarb1 and Htr2c gene expression in the offspring brain. (A) Fold changes in mRNA gene expression of Adar (A1), Adarb1 (A2) and Htr2c (A3) in the PFC of offspring of PRS (O-PRS) and control (O-C) dams treated with VEH or FLX prior to gestation. (B) Fold changes in mRNA gene expression of Adar (B1), Adarb1 (B2) and Htr2c (B3) in the amygdala of offspring of PRS (O-PRS) and control (O-C) dams treated with VEH or FLX prior to gestation. Fold change values are presented as means ± SE of the fold change relative to O-C). #P < 0.075. *P < 0.05. **P < 0.001. Gray panels show previously published data [22]. N's, Adar, PFC: VEH, O-C 5, O-PRS 8, FLX, 6,7; amygdala: VEH, 4,9, FLX 7,5. Adarb1, PFC: VEH, O-C 5, O-PRS 8, FLX, 7,7; amygdala: VEH, 4,8, FLX 7,6. Htr2c, PFC: VEH, O-C 6, O-PRS 8, FLX, 7,8; amygdala: VEH, 4,8, FLX 6,6.

