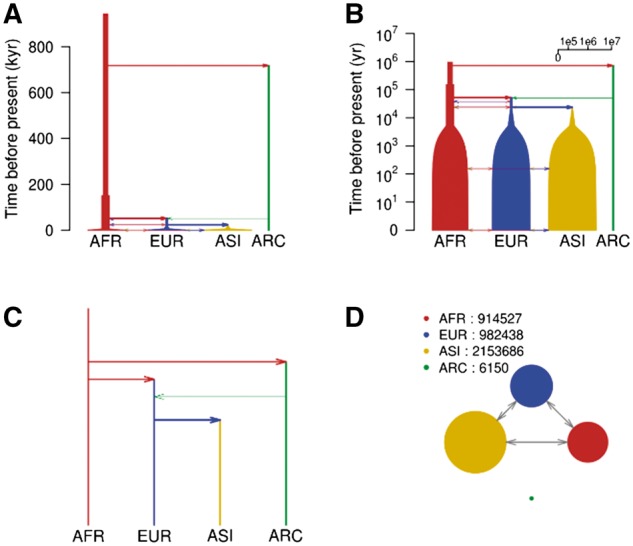
Fig. 1.

Visual representations of demography in MaCS simulation script for a modified Tennessen model (Box 1) (Vernot et al., 2016). AFR: Africans; EUR: Europeans; ASI: Asians; ARC: Archaic humans. (A) Use a time unit of 1000 years and scale the population size logarithmically. (B) Zoom in on the recent events and scale the population size logarithmically. (C) ‘topology’ of migrations with rates ≥ 0.001 per generation. (D) Migrations and population sizes 1000 years ago, with population sizes scaled linearly. A–C are generated by the PlotMS() function, D is generated by the PlotMig() function
