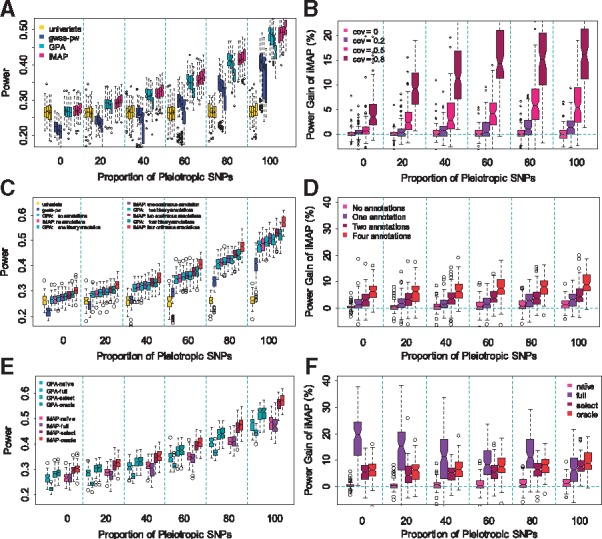
Fig. 1.

Comparison of power in detecting associated SNPs by various methods in simulations. In all simulations, the proportion of pleiotropic causal SNPs varies from 0% to 100% (x-axis). Power is measured at a fixed FDR of 0.05. (A) Power of four methods (univariate analysis, gwas-pw, GPA and iMAP) in the setting where the two traits are positively correlated. For each method, the four boxplots at each pleiotropic proportion level correspond to four different phenotypic covariance values of 0, 0.2, 0.5 and 0.8, respectively. (B) Power gain of iMAP with respect to GPA computed based on panel (A). (C) Power of four methods (univariate analysis, gwas-pw, GPA and iMAP) in the presence of informative annotations. Variations of GPA and iMAP that incorporate a different number of annotations (0, 1, 2 and 4) are also presented. (D) Power gain of iMAP with respect to GPA computed based on panel (C). (E) Power of GPA and iMAP in the presence of four informative annotations and 100 noninformative annotations. Different variations of GPA and iMAP are considered: the naïve version does not incorporate any annotations; the full version includes all the annotations; the select version performs annotation selection; and the oracle version uses the four informative annotations. (F) Power gain of iMAP with respect to GPA computed based on panel (E)
