
Fig. 3.
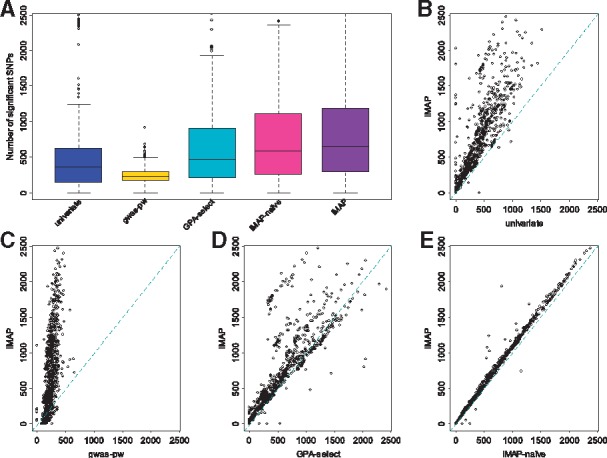
Power comparison among methods for the 1128 trait pairs analyzed in the real data application. Methods for comparison include: univariate, gwas-pw, GPA-select, iMAP-naïve and iMAP. (A) Boxplots show the number of associated SNPs that pass the genome-wide significance threshold identified by various methods across 1128 trait pairs. The number of associated SNPs identified by iMAP for each trait pair is also plotted against that identified by (B) univariate, (C) gwas-pw, (D) GPA-select and (E) iMAP-naïve