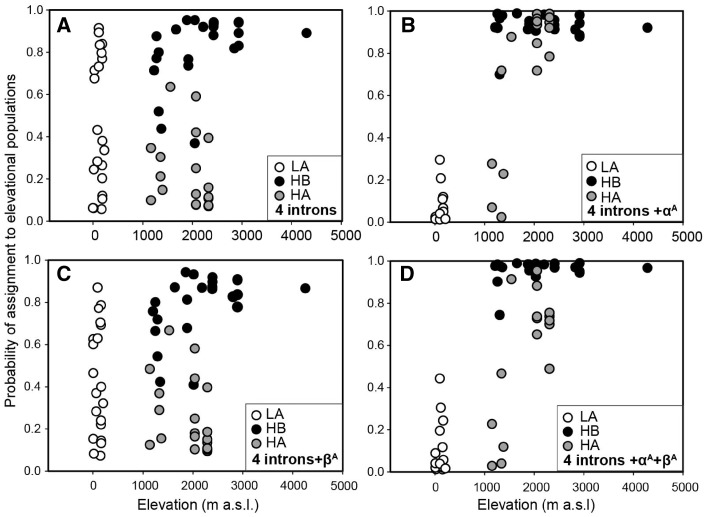
Figure 3.
Posterior probability of individual assignment to highland and lowland populations in STRUCTURE 2.3. Black, gray, and white represent individuals from population HB, HA and LA (Fig. 2). (A) 4 introns of reference loci, (B) 4 reference introns and αA-globin gene, (C) 4 reference introns and βA-globin gene, (D) 4 reference introns and 2 hemoglobin genes. The higher divergence occurs in the dataset including αA-globin gene but lower with βA-globin gene add-in.

