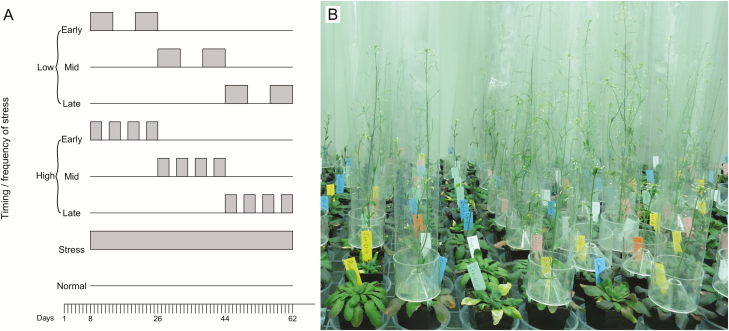
Figure 1.
(A) Schematic of the six temperature fluctuation treatments—with three timings (early/mid/late) and two frequencies (low/high) of temperature stress—and two continuous control treatments at normal and stressful temperature. The grey blocks indicate the periods during which the plants experienced temperature stress. (B) Close-up of some of the experimental plants (photo: J.F.S.).

