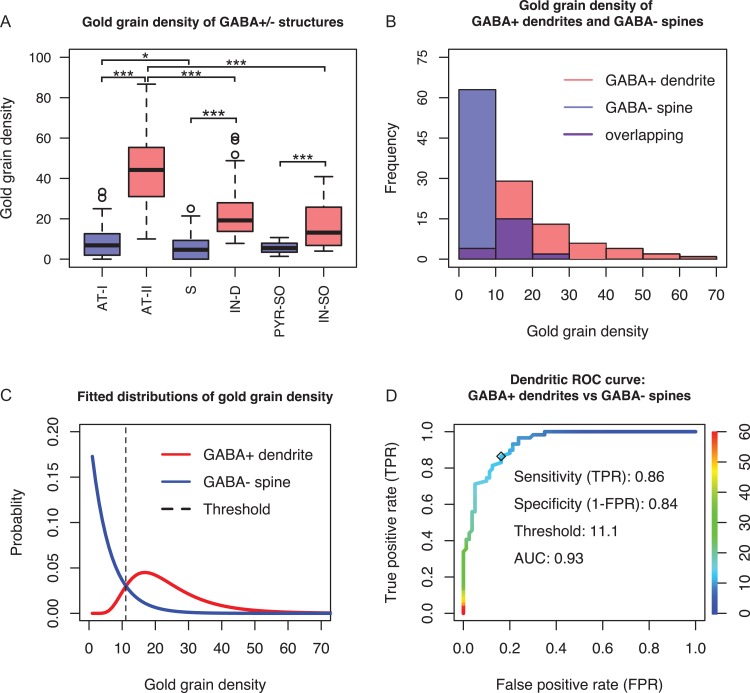
Figure 3.
Quantitative evaluation of anti-GABA immunostaining and generation of threshold for GABA-immunopositive dendrite. (A) Box plot of gold grain density (gold grains/μm2) of ultrastructurally defined GABA-positive (GABA+; red boxes; n = 134) and GABA-negative (GABA-; blue boxes; n = 184) profiles. Mann–Whitney U test shows significant differences in gold grain density between groups: At-I (n = 92) vs At-II (n = 59), S (n = 80) vs IN-D (n = 59), PYR-SO (n = 12) vs IN-SO (n = 16), At-II vs IN-D, At-II vs IN-SO (***P < 0.001), and At-I vs S (*, P = 0.05). (At-I: axonal terminal forming an asymmetric Type I synapse; At-II: axonal terminal forming a symmetric Type II synapse; S: spine; IN-D: interneuron dendrite; PYR-SO: pyramidal cell soma; IN-SO: interneuron soma). (B) Histograms of gold grain density of interneuron dendrites and spines. The two groups were taken as positive and negative classes for generating the classifier which was used for estimating immunopositive dendrites among VIP cell targets. (C) Histograms in (B) were fitted with log-normal distribution and exponential distribution. Goodness of fit was evaluated by Chi-square test. Since both P values (0.40, 0.68) are much higher than 0.05, the two distributions fit well the empirical datasets. The threshold is the optimal cut-off point (dashed line). If gold grain density of a targeted dendrite is above or below threshold, it will be classified as immunopositive or immunonegative, respectively. (D) Empirical dendritic ROC curve plotted by using the dataset in (B). The ordinate (right) illustrates the color coding of cut-off points which are displayed on the colorized ROC curve. The optimal cut-off point 11.1 gold grains/μm2 was found by using the method ROC01 (closest point to (0,1)). It also generates high sensitivity, specificity and area-under-the-curve (AUC) values.

