
Fig. 4.
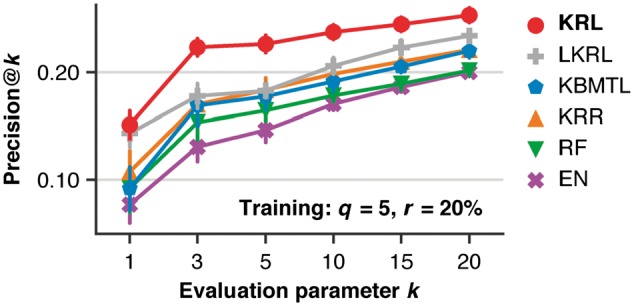
Comparison of KRL with related work (see Section 3.6 for details) in terms of Precision@k (for different values of the evaluation parameter k) using the subsampled training datasets, keeping five drugs (q) per cell line sampled from the 20% of the cell line's most effective drugs (r). The error bars show standard deviations from 10 randomly subsampled training datasets