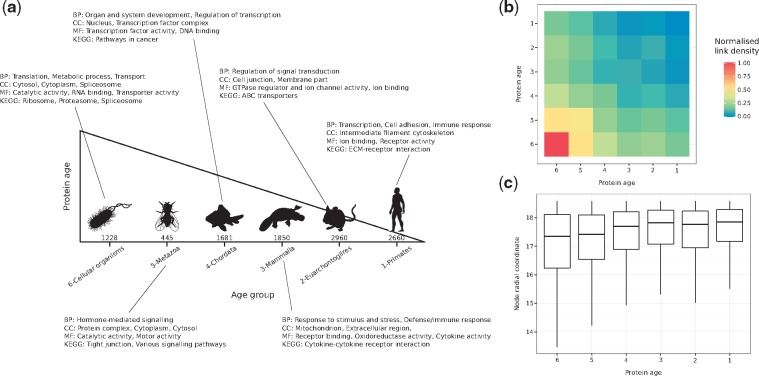
Fig. 1.
(a) Proteins in the constructed hPIN were clustered into six different age groups (the number of proteins in each one is indicated). Over-represented biological functions and compartments in each group were determined via GO and KEGG pathway enrichment analyses (BP: Biological Process, CC: Cellular Compartment, MF: Molecular Function). (b) Normalized link density within and between age groups. (c) Distribution of inferred radial coordinates for the proteins in each age group

