
Fig. 4.
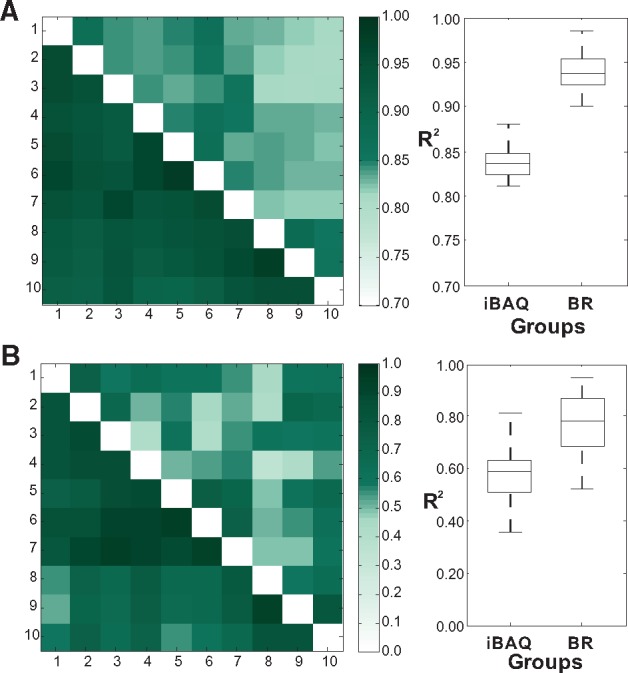
Comparison of quantification consistency of best-responder peptides with iBAQ using 293T proteins. (A) Heatmap illustrates the pairwise correlation coefficient (R2) of quantifications of all proteins between each pair of experiments. The upper triangular part of heatmap is the coefficient by iBAQ, and the lower triangular part is the coefficient by best responder peptides method. Darker colours reflect higher coefficient of experiments. Box plot illustrates the distribution between the two groups. (B) Heatmap illustrate the pairwise correlation coefficient (R2) of quantifications of lowest-abundance proteins between each pair of experiments. Box plot illustrates the distribution between the two groups