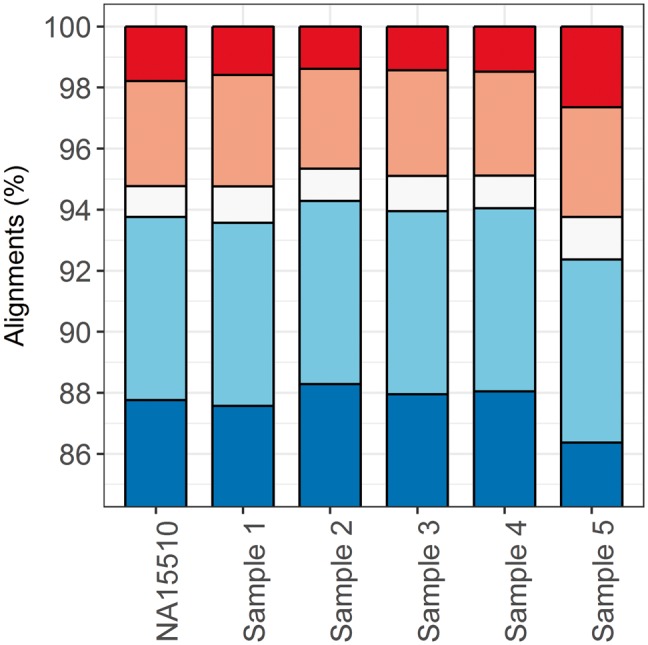
Fig. 3.

Impact of the alignment improvement strategies. The alignment percentages are shown for five distinct categories from bottom to top: aligned reads (blue), reads rescued by the double seeding strategy (light blue), reads filtered by decoy amplicons (white), reads filtered due to high number of mismatches (light red), not aligned reads (red) (Color version of this figure is available at Bioinformatics online.)
