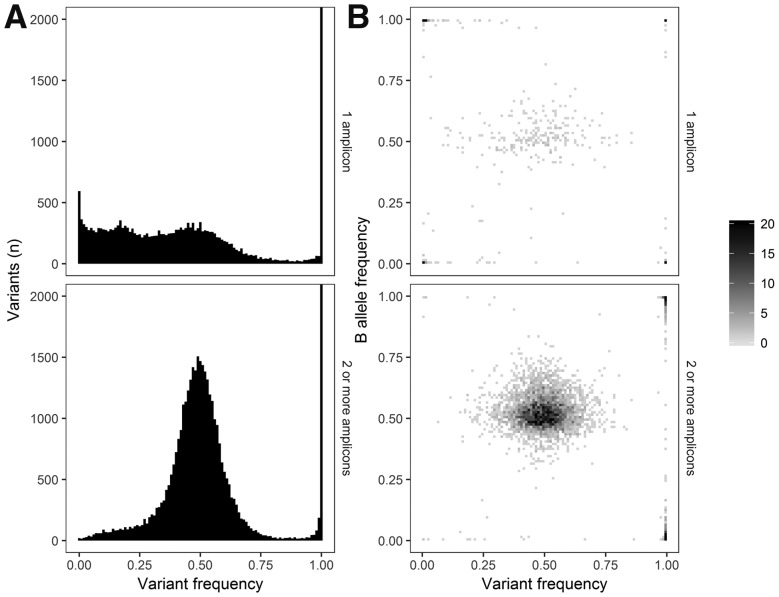
Fig. 7.
Variant frequencies (A) The variant frequency is set out against the number of amplicons in which the variant is found. Variants found in one amplicon are shown in the top row. Variants found in multiple amplicons are in the bottom row. Variants of which the locations were called with quality below 600 were omitted from the figure. (B) Comparison of variant frequencies from SNP array with those of Nimbus split between one (top) or multiple amplicons (bottom)

