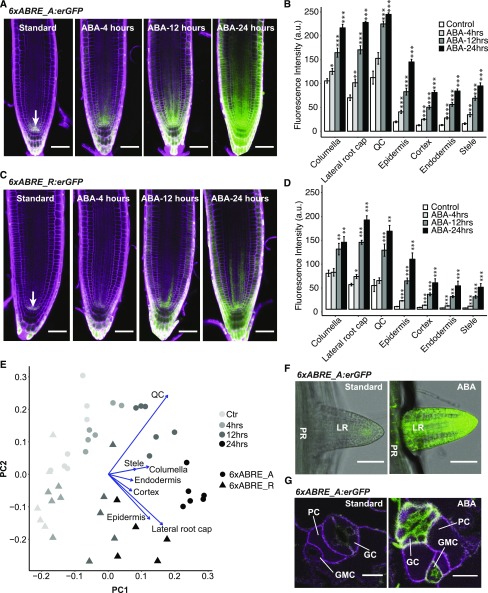
Figure 3.
ABA responsiveness of 6xABRE SP reporters. A, Confocal images of 6xABRE_A SP homozygous reporter expression in root tips under 4 , 12, and 24 h of ABA (10 μm) treatment. B, Bar chart showing the averaged fluorescence level of 6xABRE_A SP reporter in various cell types quantified by CellSeT (n ≥ 5). C, Confocal images of 6xABRE_R SP homozygous reporter expression in root tips under 4 h, 12 h, and 24 h of ABA (10 μm) treatment. D, Bar chart showing the averaged fluorescence level of 6xABRE_R SP reporter in various cell types quantified by CellSeT (n ≥ 5). E, Principal component analysis (PCA) with loadings of the expression data from the 6xABRE_A SP and 6xABRE_R SP reporters under 10 μm ABA or no ABA (Ctr) treatment. F, Confocal images of 6xABRE_A SP reporter expression in lateral roots after 3 d 10 μm ABA treatment. G, Confocal images of 6xABRE_A SP reporter expression in leaf epidermis after 24 h ABA treatment. LR, lateral root; PR, primary root; GC, guard cell; GMC, guard mother cell; PC, pavement cell. Scale bars, 50 μm. Student’s t test significance level, *0.01 < P < 0.05, **0.001 < P < 0.01, ***P < 0.001. Error bars, se.

