Figure 5.
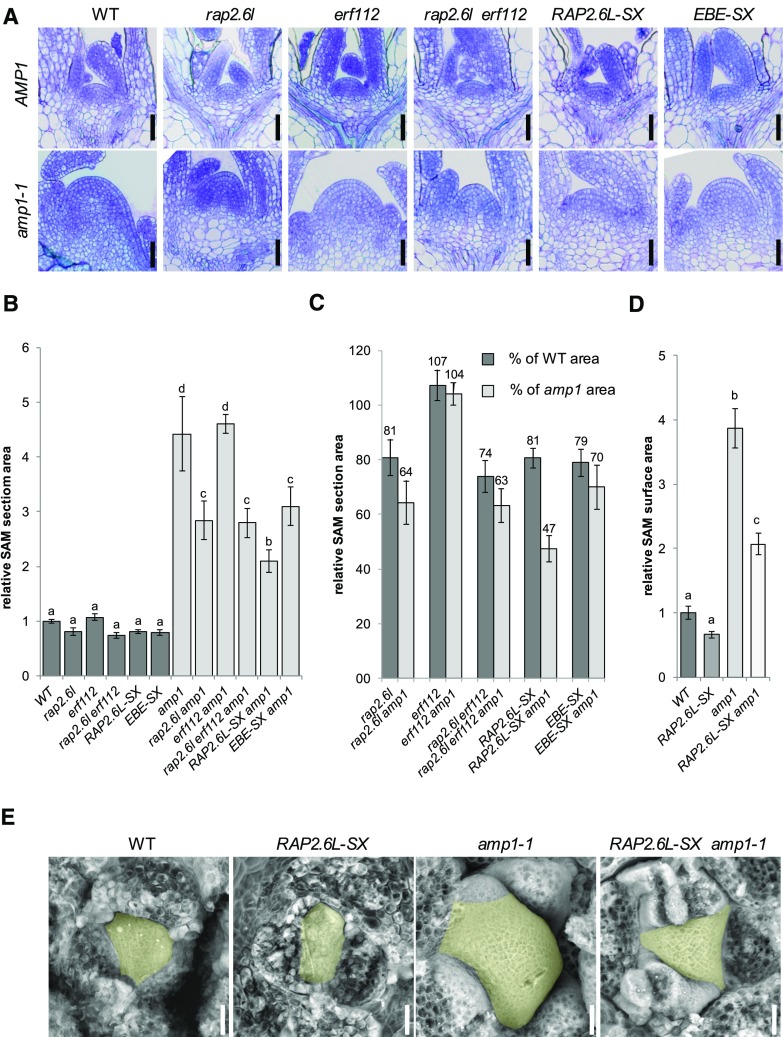
Compromised function of RAP2.6L affects SAM size in the amp1 mutant. A, Median longitudinal SAM sections of wild-type Col-0 (WT), rap2.6l-1, erf112-1, rap2.6l-1 erf112-1, RAP2.6L-SX, and EBE-SX plants in the wild-type background at 7 DAG (top) and median longitudinal SAM sections of the same lines in the amp1-1 background at 7 DAG (bottom). B, Quantification of the SAM area from median longitudinal sections of the indicated genotypes at 7 DAG (bars represent means ± se; n ≥ 4). The SAM areas were normalized to that of wild-type Col-0 (wild type = 1). Bars for plant lines in the wild-type background are colored in dark gray, and bars for lines in the amp1-1 background are colored in light gray. Different letters over the error bars indicate significant differences (P < 0.05) as estimated by Duncan’s multiple range test. C, Relative reduction of median SAM section areas by the indicated genotypes compared to wild-type Col-0 (WT) and the amp1-1 mutant based on the data shown in B. Bars represent normalized values ± se; n ≥ 4. Normalized values are shown above the error bars. D, Quantification of SAM surface area from scanning electron micrographs of the indicated genotypes at 7 DAG (bars represent means ± se; n ≥ 3). The SAM areas were normalized to that of wild-type Col-0 (wild type = 1). Different letters over the error bars indicate significant differences (P < 0.05) as estimated by Duncan’s multiple range test. E, Scanning electron micrographs of the SAM of wild-type Col-0 (WT), RAP2.6L-SX, amp1-1, and RAP2.6L-SX amp1-1 seedlings. The SAM areas are highlighted in yellow. Bars = 25 μm (A and E).

