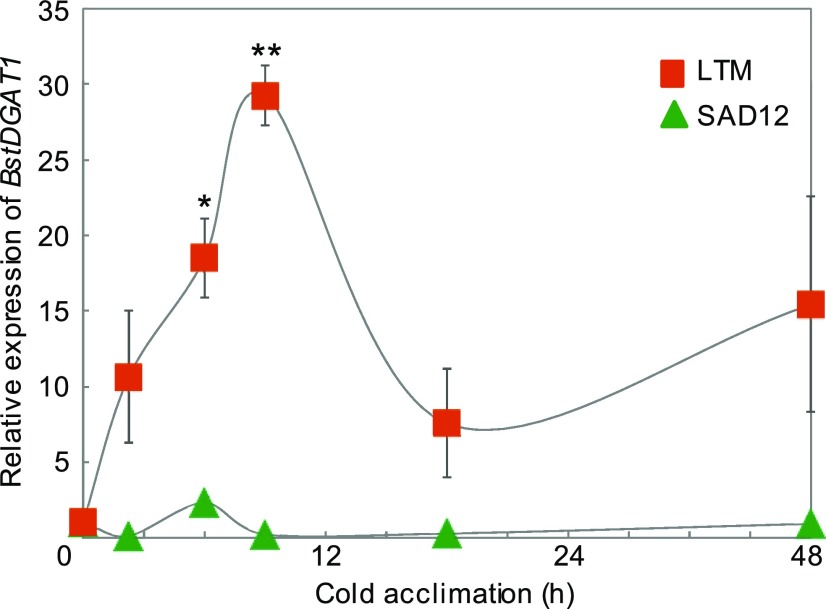
Figure 3.
Time course of relative BstDGAT1 expression in B. stricta SAD12 and LTM seedlings during cold acclimation at 4°C. Values are relative to the control (no cold treatment). Significant ecotypic differences are indicated by asterisks (*P < 0.05 and **P < 0.01; Student’s t test ); data represent means (±se) of three biological replicates.

