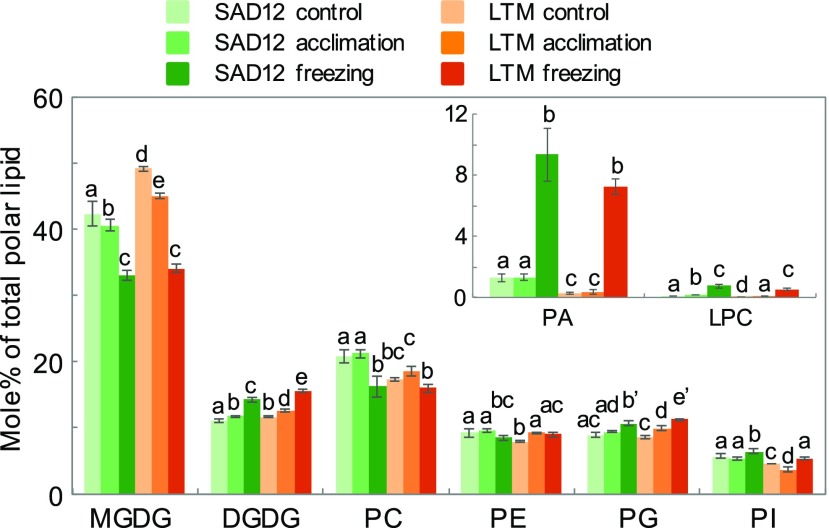
Figure 4.
Polar glycerolipids of B. stricta SAD12 and LTM seedlings subjected to control conditions, cold acclimation, or cold acclimation followed by freezing. Immediately after treatment, total lipids were extracted from the aerial parts of plants for quantitative lipidomics analysis. The minor phospholipids PA and LPC are shown in the inset. Bars marked with different letters indicate statistical differences within a lipid class (P < 0.05, ANOVA); differences between genotypes under the same conditions are at P < 0.01 unless marked with a prime (P < 0.05); data represent means (±sd, n = 5–6).

