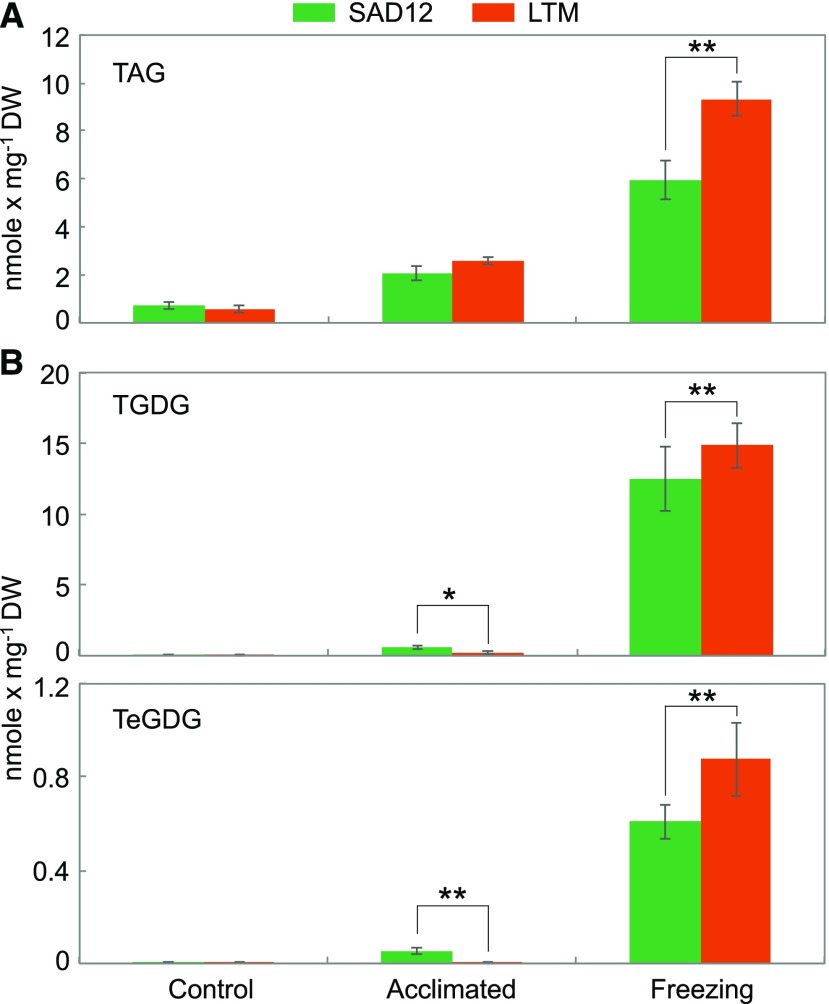
Figure 6.
Accumulation of TAG, TGDG, and TeGDG in B. stricta SAD12 and LTM seedlings subjected to control conditions, cold acclimation, or cold acclimation followed by freezing. Significant ecotypic differences are indicated by asterisks (*P < 0.05 and **P < 0.01; ANOVA); data represent means (±sd, n = 5–6).

