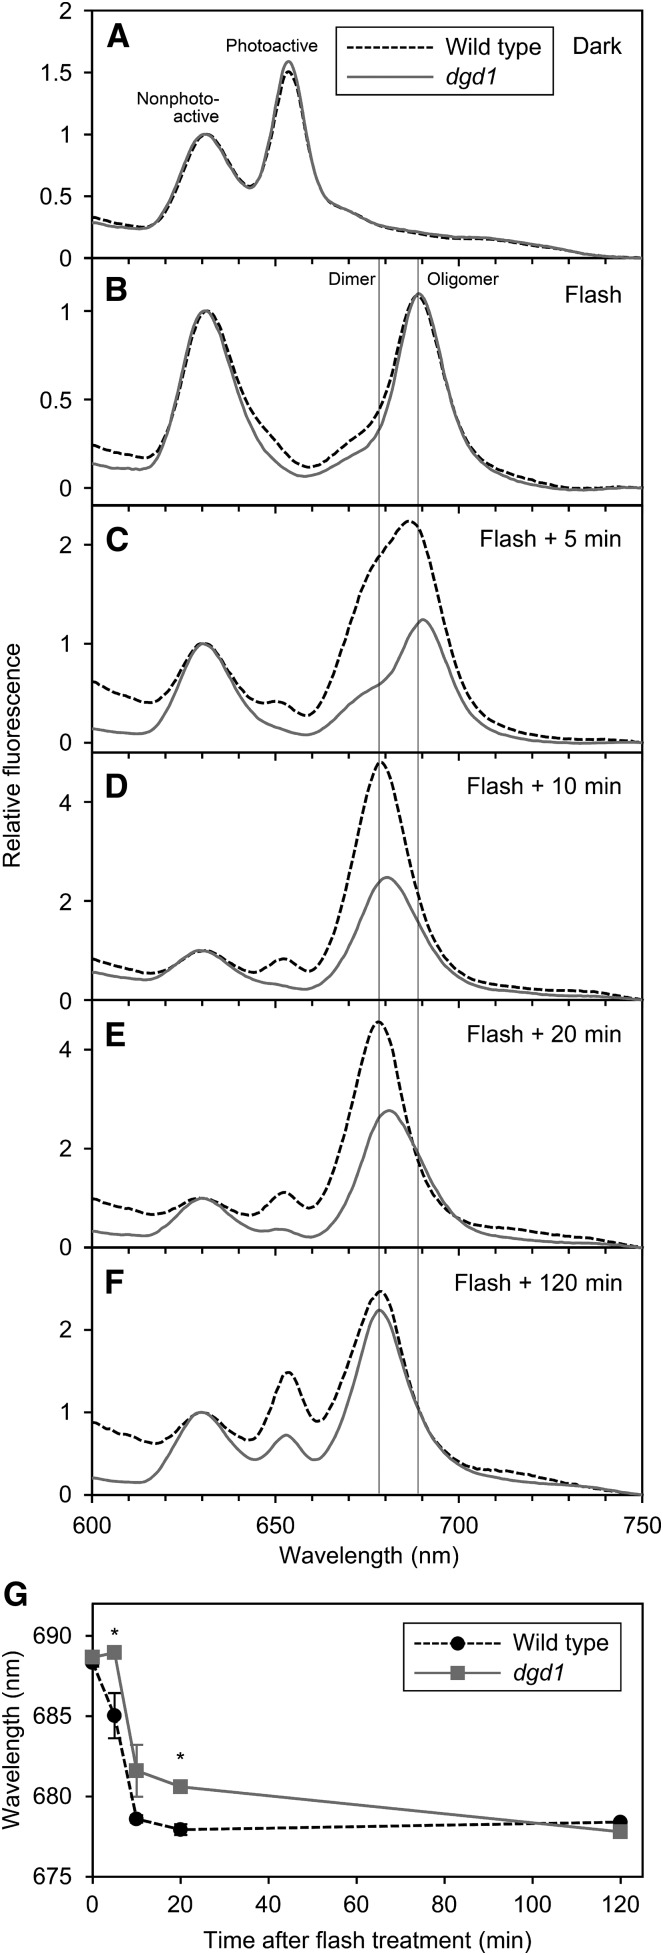
Figure 4.
In situ 77K fluorescence spectra in 4-d-old etiolated cotyledons of the wild type and dgd1 under 440-nm excitation. A and B, Fluorescence spectra in cotyledons frozen before (A) and immediately after (B) the flash treatment. C to F, Fluorescence spectra in cotyledons frozen after dark incubation for 5 min (C), 10 min (D), 20 min (E), and 120 min (F) after the flash treatment. Representative data from three (wild type at 0, 10, 20, and 120 min and dgd1 at 0, 10, and 120 min), four (dgd1 at 20 min), five (dgd1 at 5 min), and six (wild type at 5 min) biologically independent experiments are shown. In B to F, vertical lines indicate the peak wavelength of oligomeric Chlide-LPOR-NADP+ complex (Oligomer) and dimeric Chlide-LPOR-NADPH complex (Dimer). G, Overview of the Shibata shift after the flash treatment. Data are represented as means ± se from three to six independent experiments. Asterisks indicate significant differences from the wild type (*, P < 0.05, Student’s t test).

