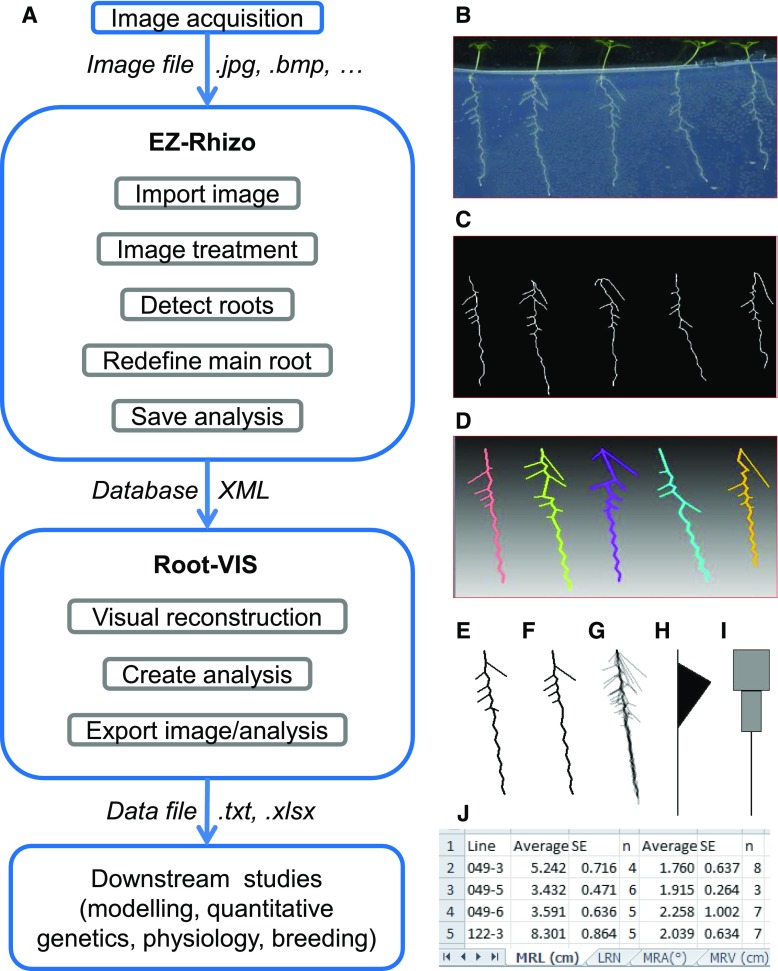
Figure 1.
Overview of EZ-Root-VIS pipeline. A, EZ-Rhizo and Root-VIS software packages provide a convenient analysis pipeline transforming root images into a numerical and statistical data output describing root system architecture. B, A suitable image of Arabidopsis plants growing on a vertical agar plate can be acquired with a flatbed scanner at 200 dpi. C, Skeletonized roots obtained after image processing with EZ-Rhizo provide the basis for quantification of RSA features by EZ-Rhizo. The obtained data are saved in a searchable database. D, Root-VIS reconstructs the individual roots using the data extracted by EZ-Rhizo. E to J, Root-VIS generates visual reconstructions of root system architecture from a user-defined set of individual roots (replicates), including absolute (E) and binned (F) average RSA, alpha blends (G), flag plots (H), and LR profiles (I). The examples shown are based on data from the five individual Arabidopsis plants shown in B. Roots images were taken at 12 DAG. J, For subsequent generation of graphs, statistical analyses, and modeling, the numerical data obtained with Root-VIS are saved and can be displayed in Excel using the XL-Orate plug-in. The screenshot shows an example Excel output from a large data set. Data for each RSA parameter are provided in a separate datasheet. MRL, Main root path length; LRN, lateral root number; MRV, main root vector length.

