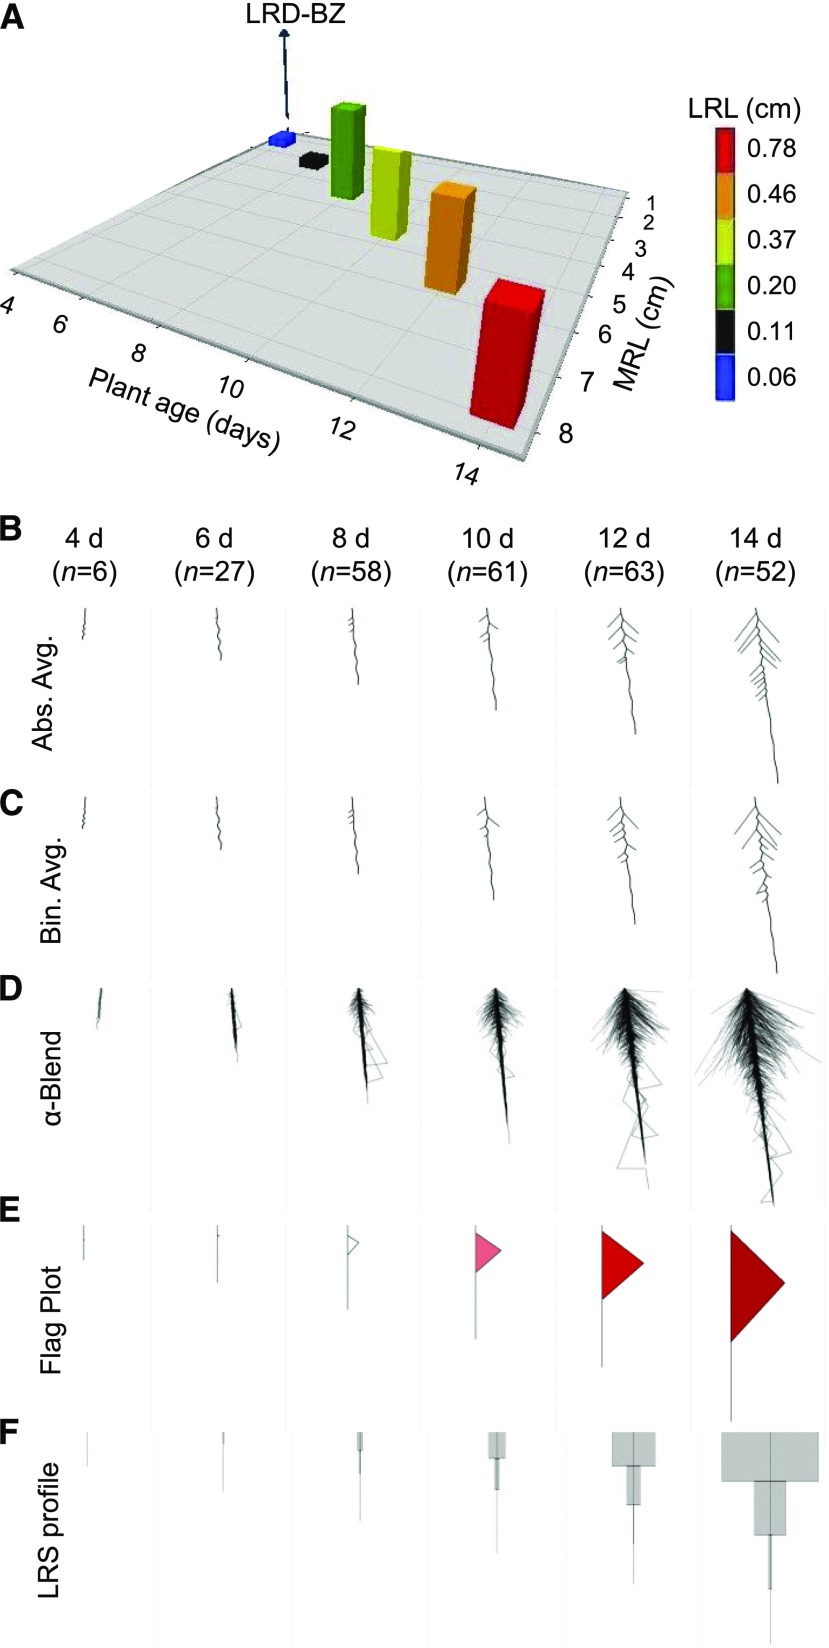
Figure 2.
Visual representation of RSA development over time. A, Change of selected RSA features over time displayed in a conventional bar graph. Plotted are plant age in days after germination (x axis), mean LRD-BZ (y axis), mean main root length (MRL; z axis), and mean LRL (color) of Arabidopsis Col-0 plants growing on control media. Numbers of roots analyzed at each time point are given in B. B to F, Root-VIS offers several options to visualize the RSA of many replicate plants, including absolute (B) and binned (C) average RSA reconstructions, superimposition of normalized RSAs in alpha blends (D), as well as shape reconstructions in the form of flag plots (E) and LRS profiles (F). All Root-VIS reconstructions shown were based on EZ-Rhizo data obtained from Arabidopsis Col-0 plants grown in control conditions. Plant age (in days) and numbers of replicate roots (n) are given in B.

