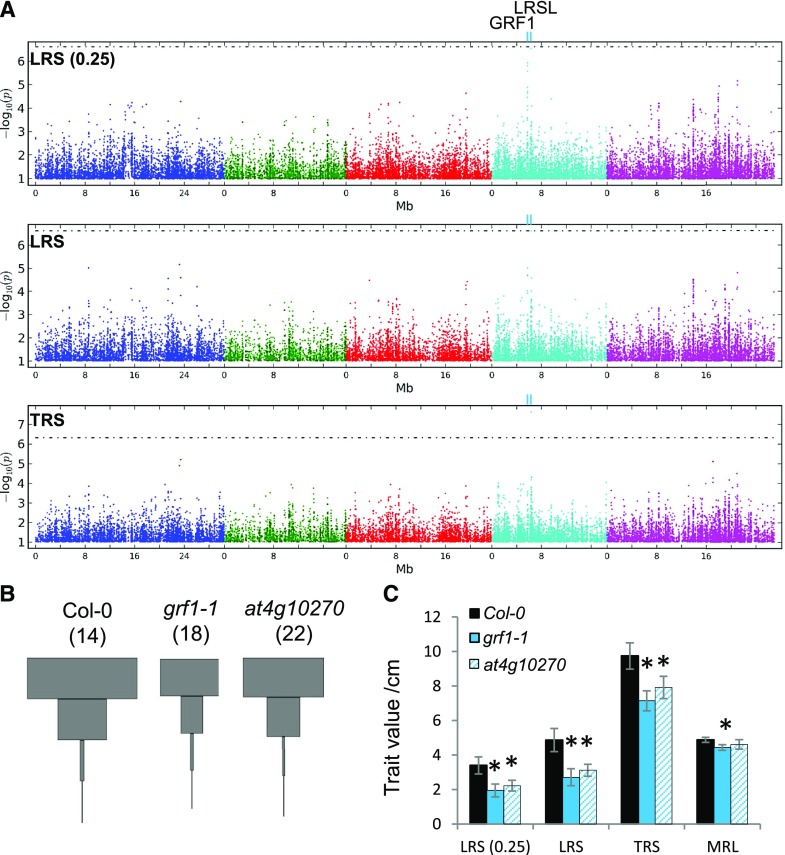
Figure 6.
Genome-wide association studies for root system architecture traits. A, Manhattan plots for GWA mapping of three RSA traits; LRS over the basal quartile of the main root [LRS (0.25)], total LRS, and total root size (TRS). The horizontal dotted line corresponds to a 5% FDR threshold. Light-blue ticks labeled “GRF1” and “LRSL” indicate the location of the most significant associations. B,) LRS profiles of Arabidopsis Col-0 wild type and mutant lines. Plants were grown on control media in three independent experiments. The total number of replicate roots contributing to each LRS profile is given in parentheses. C, Means and SEs (n as shown in B) of some RSA traits in wild type Col-0 and mutant lines. Significant differences to the wild type are indicated by asterisks (P < 0.05, Student’s t test).

