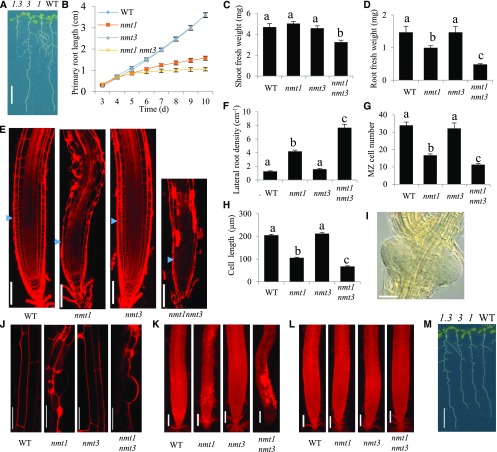
Figure 5.
NMT3 loss of function has, alone, no apparent phenotypic impact but severely impairs vegetative growth and root development in an nmt1 background. A, Overall phenotypes of 12-d-old wild-type (WT), nmt1 (1), nmt3 (3), and nmt1 nmt3 (1.3) seedlings. Bar = 1 cm. B, Kinetics of wild-type, nmt1, nmt3, and nmt1 nmt3 primary root elongation. Values are means ± se (n = 12). C and D, Shoot (C) and root (D) fresh weights of 2-week-old wild-type, nmt1, nmt3, and nmt1 nmt3 seedlings. Values are means ± se (n = 6). E, Confocal optical sections of 10-d-old wild-type, nmt1, nmt3, and nmt1 nmt3 primary roots stained with propidium iodide. Blue arrowheads indicate the boundary between the root meristem and the elongation zone. Bars = 100 µm. F, Lateral root density for 10-d-old wild-type, nmt1, nmt3, and nmt1 nmt3 roots. Values are means ± se (n = 11–12). G, Meristematic cortical cell number in wild-type, nmt1, nmt3, and nmt1 nmt3. Values are means ± se (n = 8). H, Mature cortical cell length in wild-type, nmt1, nmt3, and nmt1 nmt3 roots. Values are means ± se (n = 56–129). I, Example of a lateral root primordia cluster on a 10-d-old nmt1 nmt3 primary root, imaged by differential interference contrast (DIC) light microscopy. Bar = 50 µm. J, Confocal images of epidermal cells in 10-d-old wild-type, nmt1, nmt3, and nmt1 nmt3 primary roots stained with propidium iodide. Bars = 50 µm. K and L, Propidium iodide-stained wild-type, nmt1, nmt3, and nmt1 nmt3 roots grown in the absence (K) or presence (L) of 200 µm choline. Bars = 100 µm. M, Photographs of representative wild-type, nmt1, nmt3, and nmt1 nmt3 seedlings grown on medium supplemented with 200 µm choline. Bar = 1 cm. Bars topped with different letters within each graph (B–D and F–H) denote statistically significant genetic differences by one-way ANOVA (P < 0.05).

