Figure 6.
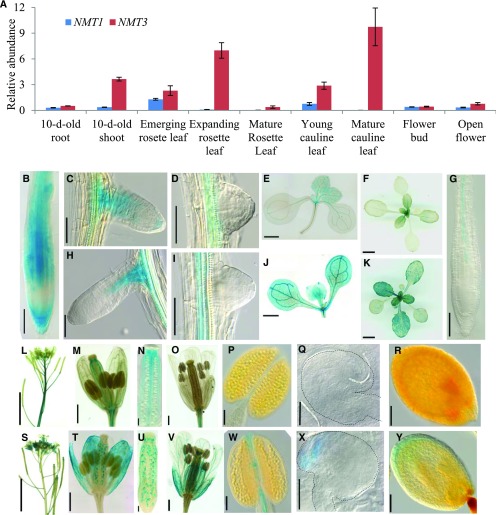
NMT1 and NMT3 are differentially expressed and have overlapping but also unique expression patterns. A, Relative NMT1 and NMT3 transcript abundance in vegetative and reproductive organs in the wild type, measured by quantitative reverse transcription PCR analysis and normalized to the abundance of housekeeping genes (AtPDF2, AtAPT1, and AtGAPDH; see “Materials and Methods”). Data shown are means ± se (n = 4 biological replicates). For 10-d-old seedlings, each replicate corresponded to a pool of 15 to 30 seedlings sampled from three different plates; for tissues sampled from soil-grown plants at later stages, each replicate corresponded to one to three individual plants. B to K, GUS staining patterns in vegetative tissues of the wild type expressing ProNMT1:GUS (B–F) or ProNMT3:GUS (G–K). Shown are primary root (B and G), young elongating lateral root (C and H), newly emerged lateral root primordium (D and I), and rosette (E and J) of 10-d-old seedlings grown on agar plates and rosette of 18-d-old plants grown in soil (F and K). Bars = 100 µm in B and G, 50 µm in C, D, H, and I, 1 mm in E and J, and 1 cm in F and K. L to Y, GUS staining patterns in reproductive organs of ProNMT1:GUS (L–R) and ProNMT3:GUS (S–Y) reporter lines. Shown are inflorescence (L and S), stage 12 flowers (M and T), expanded view of ovary (N and U), stage 13 flowers (O and V), mature anthers (P and W), ovules from stage 12 flowers (Q and X), and seeds with embryo at late heart stage (R and Y). The dashed line in each image highlights the contour of the embryo. Bars = 5 mm in L and S, 500 µm in M, T, O, and V, 100 µm in N, U, P, and W, 50 µm in Q and X, and 100 µm in R and Y.

