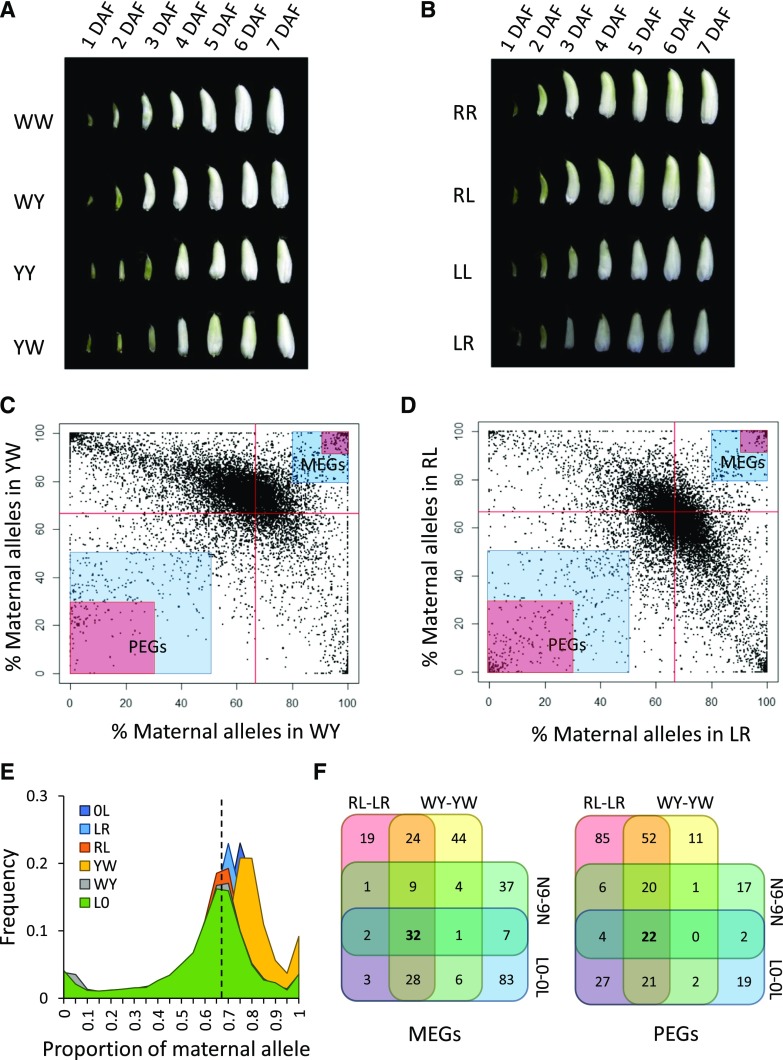
Figure 1.
Identification of imprinted genes in rice. A, Seed morphology of Wufeng-A × Wufeng-B (WW), Wufeng-A × Yu6-B (WY), Yu6-A × Yu6-B (YY), and Yu6-A × Wufeng-B (YW) at 1 to 7 d after fertilization (DAF). B, Seed morphology of Rongfeng-A × Rongfeng-B (RR), Rongfeng-A × Liuqianxin-B (RL), Liuqianxin-A × Liuqianxin-B (LL), and Liuqianxin-A × Rongfeng-B (LR) from 1 to 7 DAF. C and D, Allele-specific expression analysis in WY-YW (C) and RL-LR (D). The highlighted areas indicate moderately (2-fold higher than expected; blue) and strongly (5-fold higher than expected; red) imprinted genes. Red lines denote the 0.67 expected value. The proportion of maternal alleles is calculated by fragments per kilobase million (FPKM)maternal/(FPKMmaternal + FPKMpaternal). E, Distribution of the proportion of maternal alleles at each locus with informative SNPs in WY, YW, RL, LR, Longtepu × 02428 (L0), and 0L. The dashed line indicates the 0.67 expected value. F, Venn diagrams of imprinted genes identified from MY-YM, RL-LR, L0-0L, and Nipponbare and 9311 (N9-9N) reciprocal crosses.

