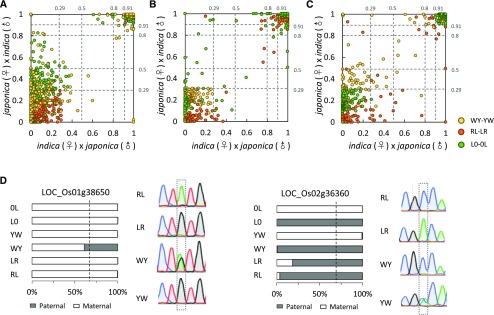
Figure 2.
Intraspecific imprinting variation in rice. A to C, Proportion of maternal alleles [FPKMmaternal/(FPKMmaternal + FPKMpaternal)] in the reciprocal crosses. A, Proportion of maternal alleles in the imprinted genes identified from RL-LR in WY-YW and L0-0L. B, Proportion of maternal alleles in the imprinted genes identified from WY-YW in RL-LR and L0-0L. C, Proportion of maternal alleles of imprinted genes identified from L0-0L in RL-LR and WY-YW. Most of the imprinted genes identified from one reciprocal cross set are imprinted in other sets. D, Examples of allele-specific imprinting in rice. The bar charts show the proportion of parental alleles in different crosses; the sequencing diagrams show the validation of intraspecific imprinting variation using RT-PCR sequencing. Dashed lines indicate the 0.67 expected value, and the informative SNPs are boxed.

