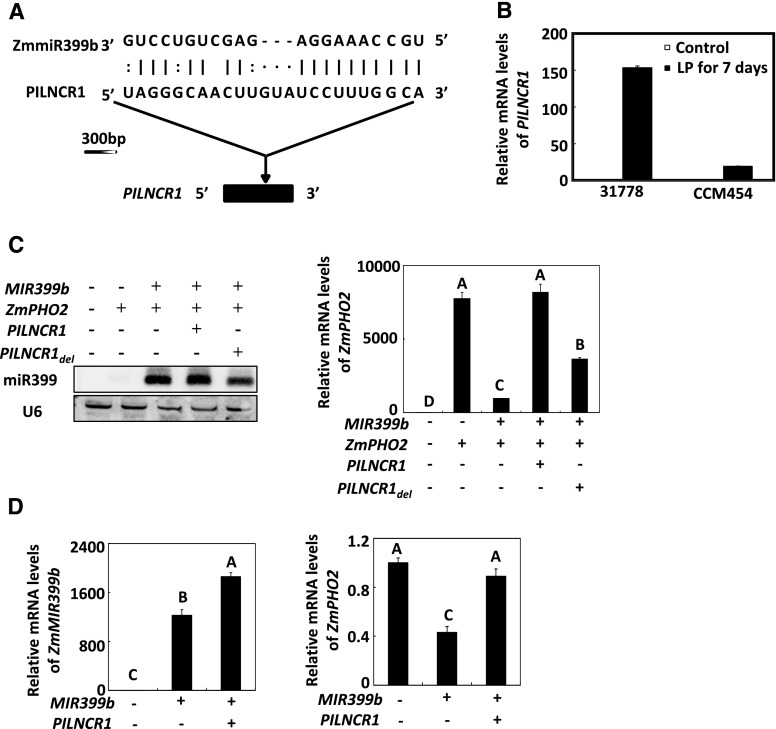
Figure 5.
Effects of PILNCR1 on ZmmiR399-guided cleavage of ZmPHO2. A, Diagram of the complementary region between PILNCR1 and miR399b in maize. B, RT-qPCR assay of the accumulation of PILNCR1 transcripts in the P-efficient line CCM454 and the P-inefficient line 31778 in response to Pi deficiency. RNA levels were normalized to that of ZmTub1. LP, low P. Values are the means ± se (n = 3). C, Coexpression of various combinations of miR399, ZmPHO2, PILNCR1, and PILNCR1del expression constructs in N. benthamiana. RNA levels were normalized to the expression of the 18S rRNA of tobacco. Error bars represent ses (n = 3). D, Coexpression of various combinations of miR399 and PILNCR1 expression constructs in maize leaf protoplasts. RNA levels were normalized to the expression of ZmTub1. Error bars represent ses (n = 3). In C and D, means with the same letter are not significantly different at P < 0.01 according to the LSD test.

