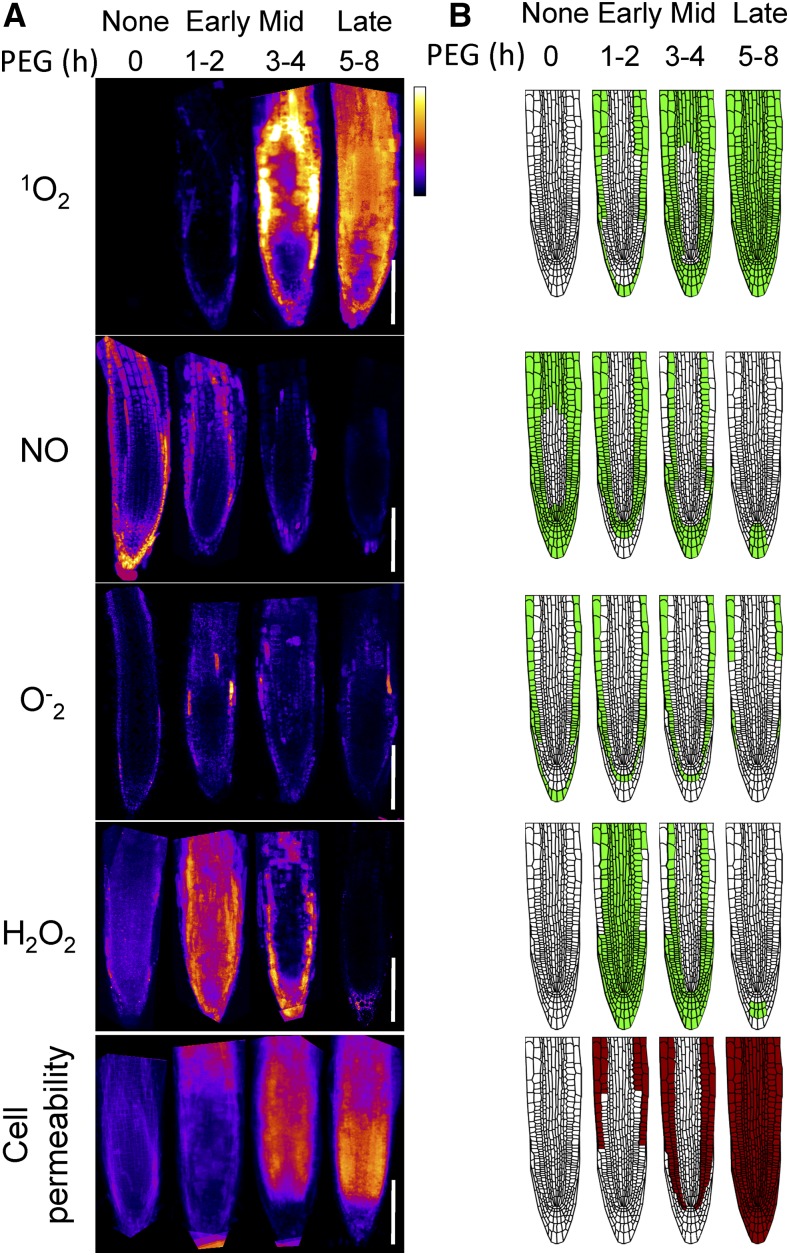
Figure 4.
Composite of multiple confocal images of ROS accumulation in root tips exposed to 30% PEG for different durations. A, Composite of confocal images that were collated for each specific signal (ROS probes and propidium iodide stain). Multiple image acquisitions for each time point were aligned manually by rotation and overlaid to create the average composite image using Matlab script. The Look Up Table was set to “Fire” and scaled to maximum as white and minimum as blue. Shown are 1O2, measured using the SOSG probe; NO, measured using the DAF-FM-AM probe; O−2, measured using the Bes-So-AM probe; H2O2, measured using the Bes-H2O2-AC probe, and cell permeability, measured using staining by propidium iodide. B, Schematic representation of the fluorescence shown in A. Scale bar, 100 µm.

