Figure 6.
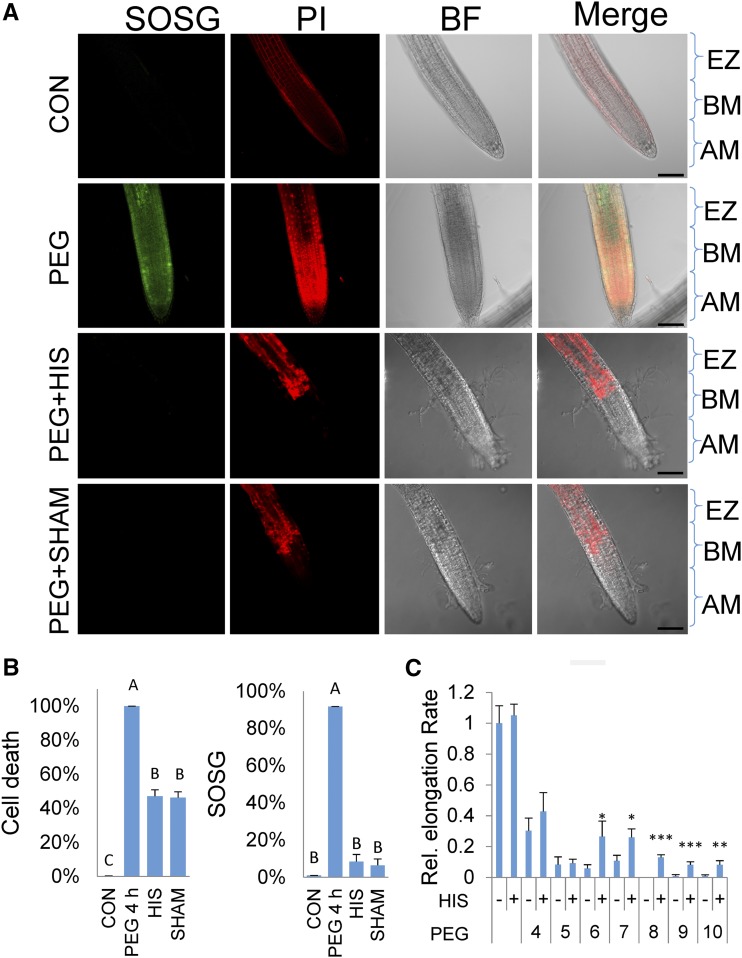
Osmotic shock treatments and the accumulation of singlet oxygen and cell death in the presence of inhibitors and scavengers. A, 7-d-old seedlings were treated with 30% PEG for 4 h and stained with singlet oxygen sensor green (SOSG) and propidium iodide (PI) with or without His (HIS, 5 mM) or salicylhydroxamic acid (SHAM, 1 mM) and viewed with a confocal microscope (see “Materials and Methods”). Confocal laser 561 nm energy settings for the control were set at Hν = 5, so that PI staining restricted to the cell walls is clearly visible. All other panels, 561-nm laser was set to Hν = 2. Zones indicated are as follows: AM, apical meristem; BM, basal meristem; and EZ, elongation zone. Bar, 100 microns. B, Quantitation of cell death and SOSG fluorescence. Left graph shows cell death as estimated by staining with PI with and without treatments as in A. Right graph shows quantitation of SOSG fluorescence with the treatments as in A. Error bars are se, n ≥ 8 seedlings. C, Root elongation rate in seedlings after 30% PEG with or without (+/−) HIS treatment 5 d after exposure to different durations of PEG and His treatments. Asterisks indicate significant difference between PEG and PEG with the addition of His (Student’s t test, *P < 0.05, **P < 0.01, ***P < 0.001). Error bars are se, n ≥ 8.

