Figure 7.
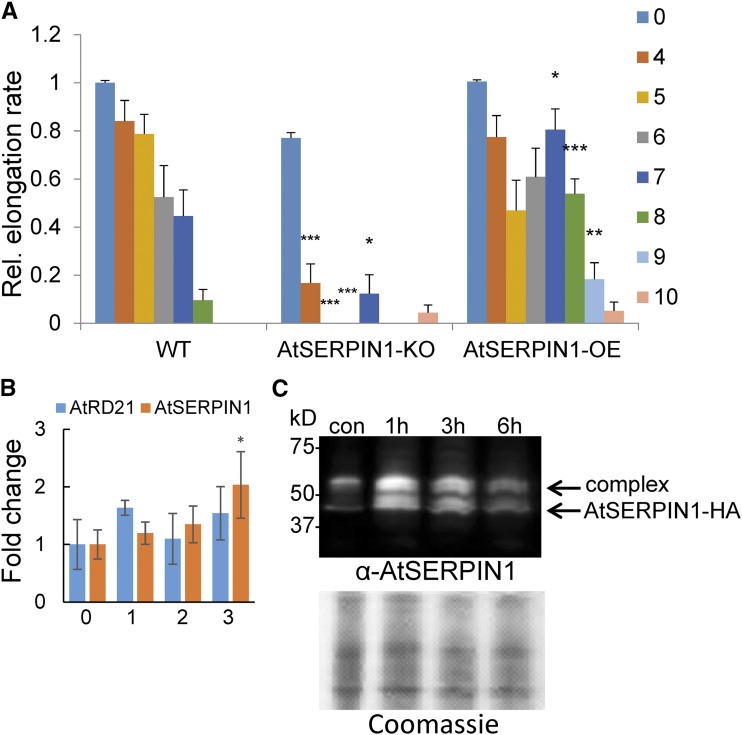
The effect of PEG-induced osmotic shock on mutant AtSERPIN1 lines. A, Quantitation of root elongation rates in wild-type (WT), AtSERPIN1 knockout (AtSERPIN1-KO), and AtSERPIN1 overexpression (AtSERPIN1-OE) lines at 7 d after the 30% PEG treatments indicated on the right (h). Error bars are se, n ≥ 8. Asterisks indicate significant difference from the wild-type sample (Student’s t test, *P < 0.05, **P < 0.01, ***P < 0.001). B, AtSERPIN1 and AtRD21 expression levels after PEG treatment. Transcript levels were measured at 0, 1, 2, and 3 h after 30% PEG treatment by RT-qPCR analysis. Error bars are se, n = 3. C, Immunoblot analysis of AtSERPIN1 after nonreducing sodium dodecyl sulfate-polyacrylamide gel electrophoresis fractionation. Immunoblot (top) of AtSERPIN1 OE roots developed with anti AtSERPIN1antibody after the indicated 30% PEG treatments. Bottom, gel stained with Coomassie blue.

