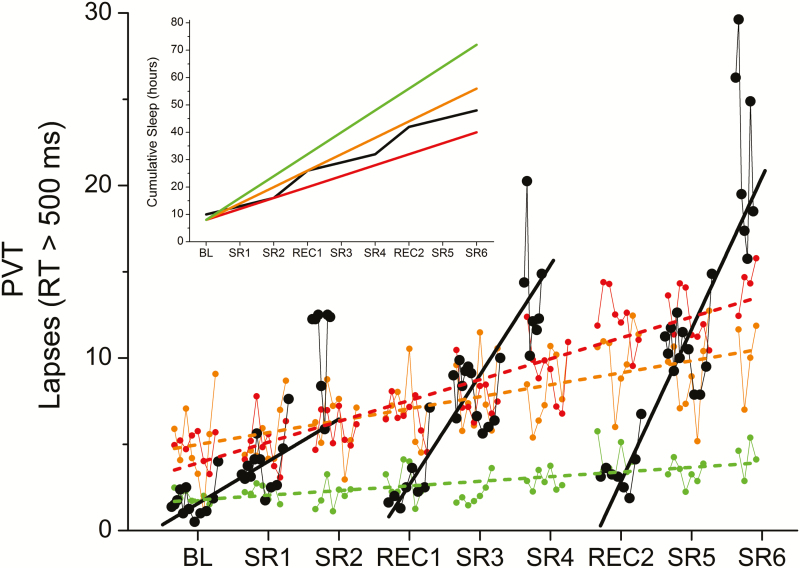
Figure 4.
Comparison of PVT lapses between chronic stable and chronic variable sleep deficiency. The time course of the PVT lapses observed during the present chronic variable sleep deficiency (CVSD) study (black filled circles) are plotted against data from an independent control dataset in which participants were scheduled to 4, 6, or 8 hours time-in-bed (TIB) sleep opportunities (red, orange, and green circles, respectively). The solid black line represents the best-fit regression line through each cycle of CVSD, as in Figure 3C, and the dashed red, orange, and green lines represent the best-fit regression lines through the 4-, 6-, and 8-hour TIB sleep opportunity data, respectively. Better performance is represented by smaller values. See the text for x-axis definitions. The inset shows the cumulative sleep amounts for the CVSD study (black lines) compared to the 4-, 6-, and 8-hour TIB sleep opportunity data (red, orange, and green lines, respectively).

