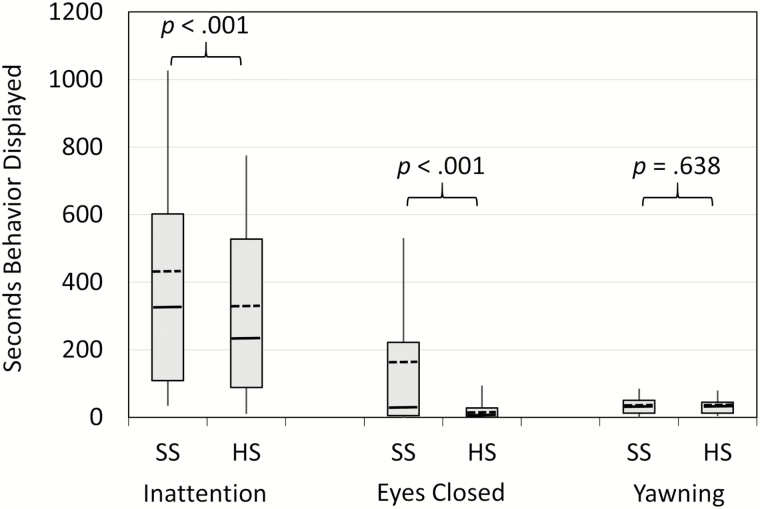
Figure 2.
Behaviors during the simulated classroom procedure across the Short Sleep (SS) and Healthy Sleep (HS) conditions. The bottom and top boundaries of each box reflect the 25th and 75th percentiles, respectively, and the tips of each “whisker” line reflect the 10th and 90th percentiles. Within each box the median is a solid line, while the mean is a dashed line.

