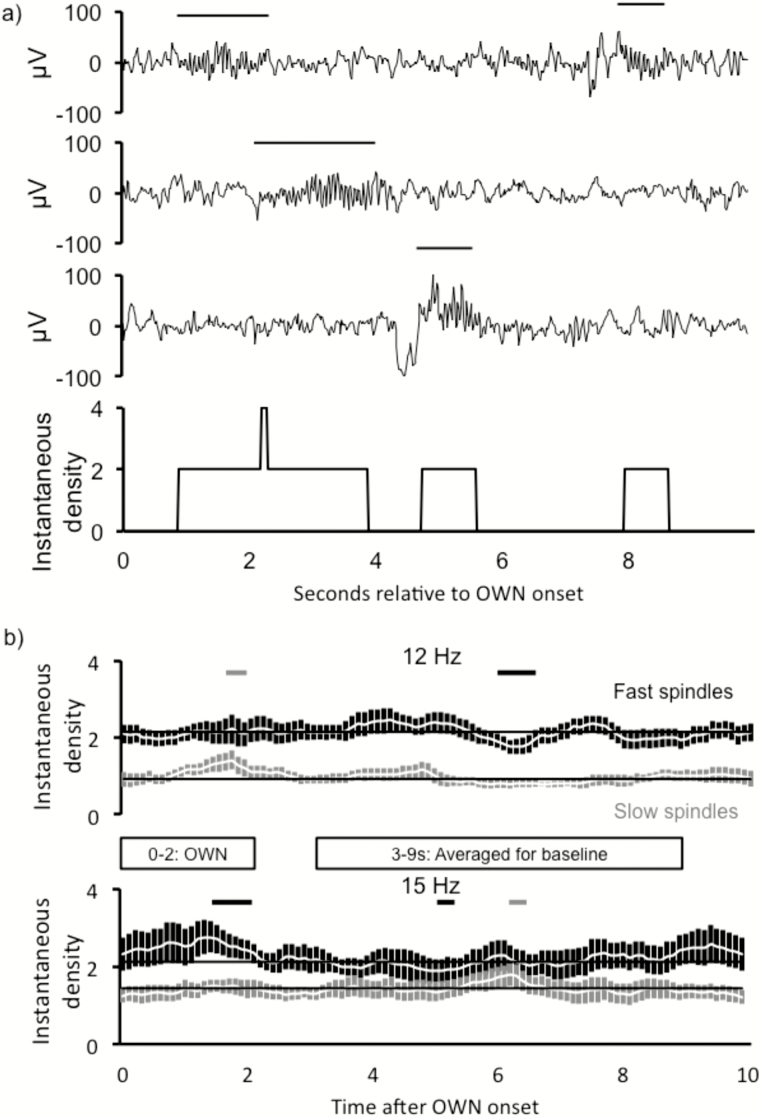
Figure 3.
Frequency-specific spindle increases occurred most strongly between 1 and 2 s of oscillating white noise (OWN) onset. (A) Method for calculating instantaneous spindle density relative to OWN onset. Three sample traces are shown with spindles occurring at different times relative to OWN onset at time 0. For each 100-ms interval during a given 10-s period, the number of spindles counted in the interval (spindles either starting during the interval or continuing into the interval) was converted into an instantaneous spindle density measure. (B) Significant frequency-specific increases manifested during 1–2 s post-OWN onset. Fast and slow spindle counts are presented in light and dark gray, respectively. Color-coded horizontal significance bars signify times during which spindle counts deviated from baseline (average count during 3–9 s post-cue).

