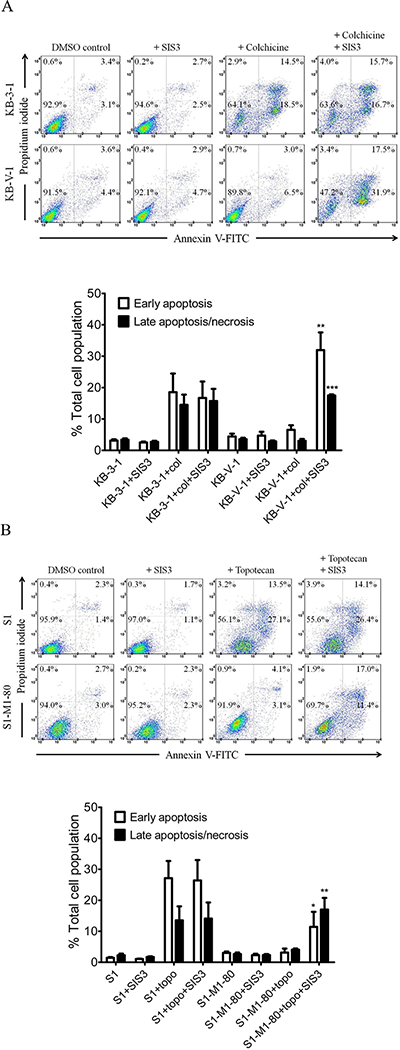
Fig. 4. SIS3 enhances drug-induced apoptosis in ABCB1- and ABCG2-overexpressing cancer cells.

(A) Human KB-3–1 epidermal cancer cells (top dot plots panels) and MDR variant KB-V-1 cancer cells (lower dot plots panels) were treated with either DMSO (control), 1.0 μM SIS3 (+ SIS3), 0.5 μM colchicine (+ colchicine) or a combination of 0.5 μM colchicine and 1.0 μM SIS3 (+ colchicine + SIS3) for 48 h. (B) Human S1 colon cancer cells (top dot plots panel) and MDR variant S1-M1–80 cancer cells (lower dot plots panels) were treated with either DMSO (control), 1.0 μM SIS3 (+ SIS3), 5.0 μM topotecan (+ topotecan) or a combination of 5.0 μM topotecan and 1.0 μM SIS3 (+ topotecan + SIS3) for 48 h. Cells were isolated and analyzed by flow cytometry according to the method described previously [66]. Representative dot plots and the mean values of three independent experiments are shown. Quantifications of drug-induced apoptosis in cancer cell lines are presented as mean ± S.D. calculated from three independent experiments. **P < 0.01; ***P < 0.001, versus the same treatment in the absence of SIS3.
