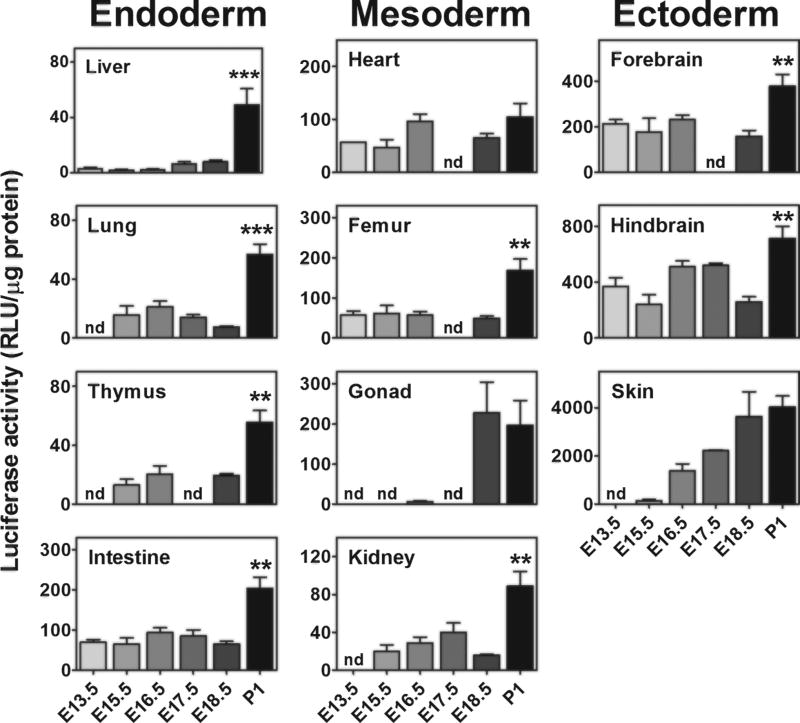
Fig. 3. Foetal ER activity shows lineage-correlation.
A pattern of ER transcriptional activity in different organs was obtained by measuring the luciferase activity on tissue lysates (enzymatic assay) obtained from the foetuses of both sexes. Each column contains organs from different germ layers. Bars represent the mean ± SEM (n = 6–10 foetuses). *p < 0.05, **p < 0.01 versus the previous stage calculated by one-way ANOVA followed by the Bonferroni post hoc test. nd = not measured.

