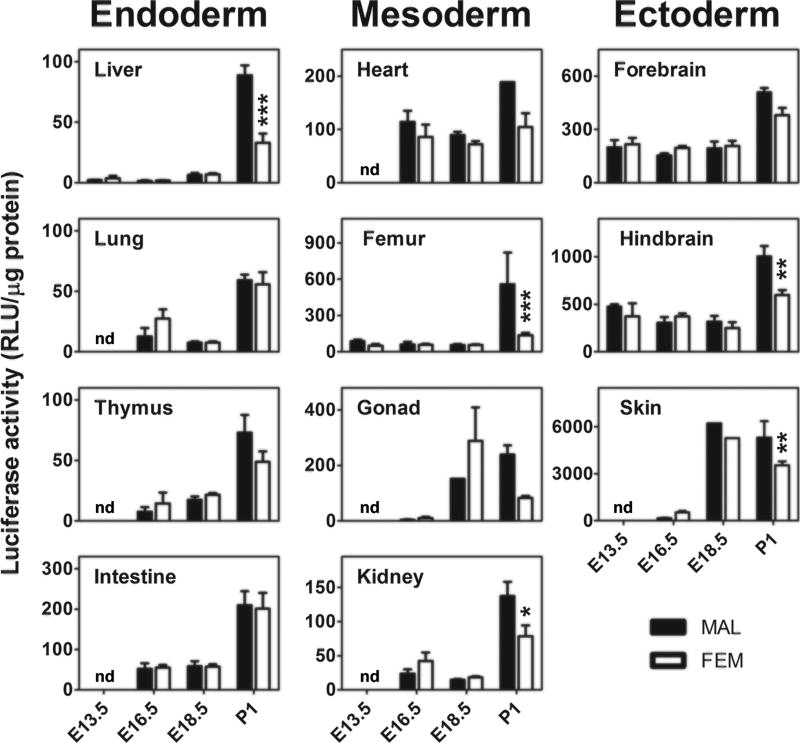
Fig. 4. Gender specificity in ER activity during development.
The same data shown in Fig. 3 (luciferase enzymatic assay) were stratified for sex. Bars represent the mean ± SEM (n = 4–6). *p < 0.05, **p < 0.01 compared with opposite gender calculated with unpaired student’s t test. nd = not measured.

